-
-
![Michael Rosen]()
-
CIO Insights are written by Angeles' CIO Michael Rosen
Michael has more than 35 years experience as an institutional portfolio manager, investment strategist, trader and academic.
RSS: CIO Blog | All Media
Updating the Triangle
Published: 01-03-2018Last year, I introduced my big picture framework of assessing the relative attractiveness of markets Inside the Triangle through the lenses of valuation, momentum and sentiment. To recap, the ideal time to buy a market is when valuation is cheap, momentum is positive and sentiment is poor. It’s best to sell when the opposites prevail: expensive valuation, poor momentum and exuberant sentiment. The 2000 internet bubble is a recent case-in-point for conditions at a market top, and March 2009 a time when the conditions to buy were very favorable. Of course, most investors find it hard to sell at the top and buy at the bottom, and generally are doing the opposite, which is why there are market tops and bottoms in the first place.
Most of the time, however, market conditions exhibit a mix of these three factors, or sides of my investment triangle. Last year, I saw valuation as expensive (bad), momentum as neutral, and sentiment as poor (good), leading, overall, to a neutral asset allocation relative to our clients’ long-term strategy. There was a lot to be worried about last year, from a volatile new President to a nuclear North Korea, but this framework kept us fully invested, and we were rewarded with strong results (admittedly much stronger than anyone expected).
Today I see more similarity with market conditions last year than notable differences, despite (because?) of the very strong performance in almost all capital markets. Valuation is still expensive, but momentum is positive and sentiment is neutral, leading to no change in our overall positioning. I’ll share what I’m seeing through these lenses.
Valuation
Below is a chart from 1900 to the present showing the percentile valuation levels of US stocks (via the Schiller P/E ratio), ten-year Treasury yields, and Investment-grade credit spreads (measured as BAA- less AAA-rated bonds). By all three metrics, stocks, bonds and spreads are very expensive relative to history.
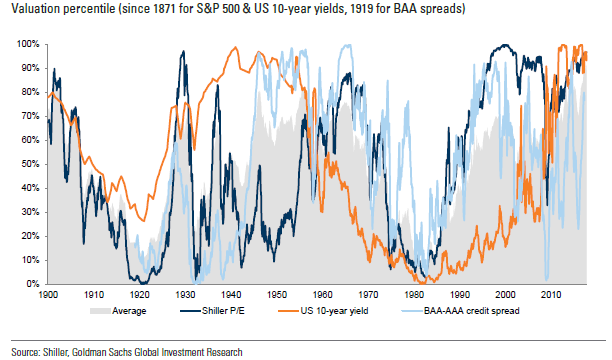
Over the long-term (10+ years), valuation is an important determinant of future returns. Over short- and intermediate-term periods, valuation is very lowly correlated with returns. One-year forward performance, for example, has an r2 <0.10 with Schiller P/E. In my analysis, valuation is important directionally, but given relatively little weight in deciding whether/when to shift portfolios.
Momentum
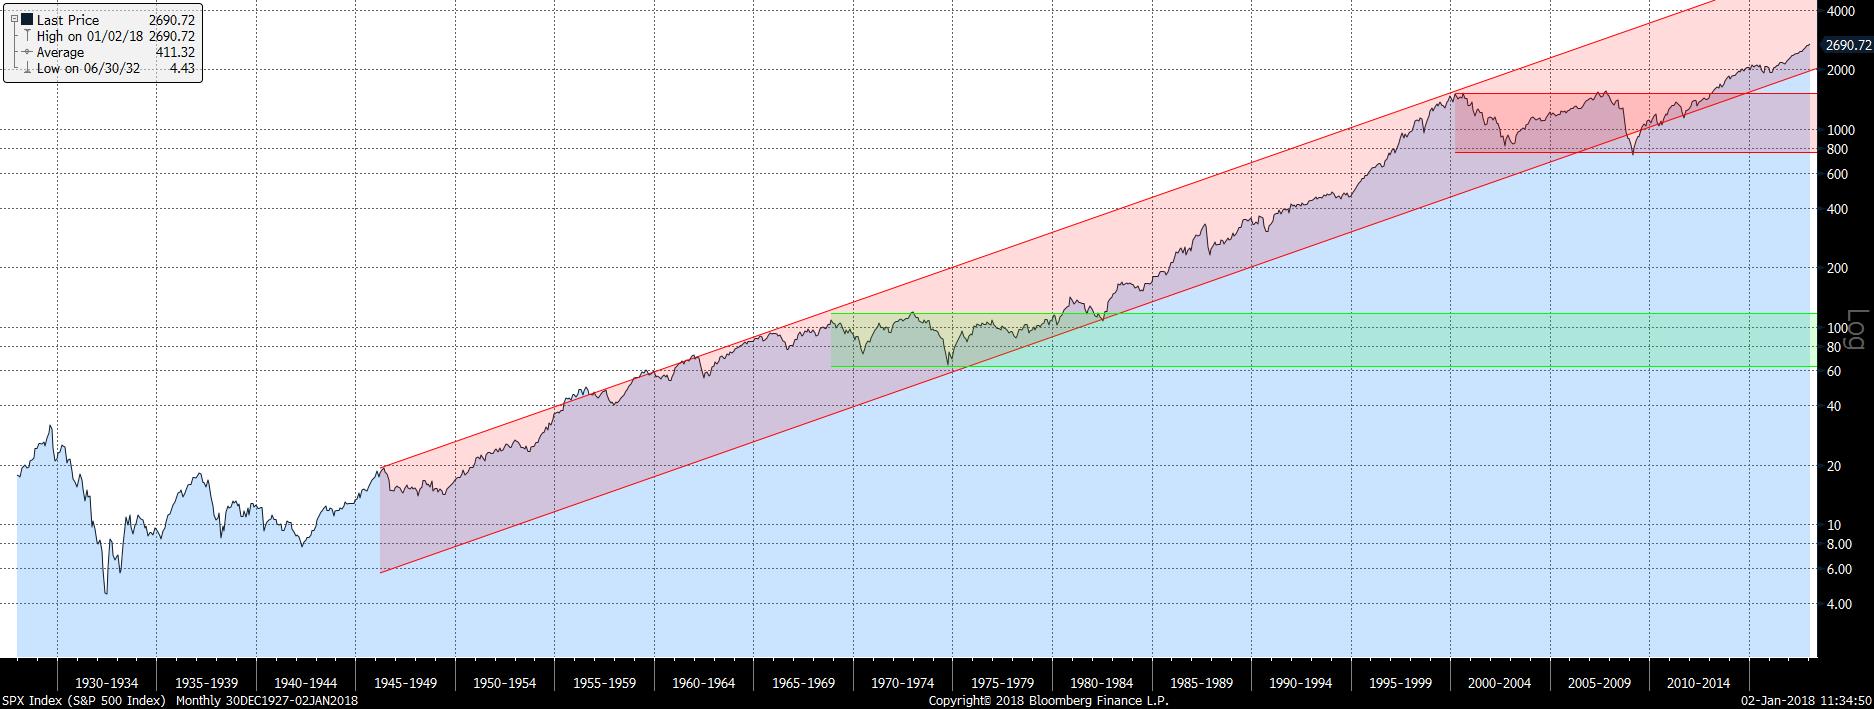
The graph below shows the S&P 500 Index from 1927 to today on a semi-log scale. I added the long-term upward channel from 1946 to highlight the long-term trend.
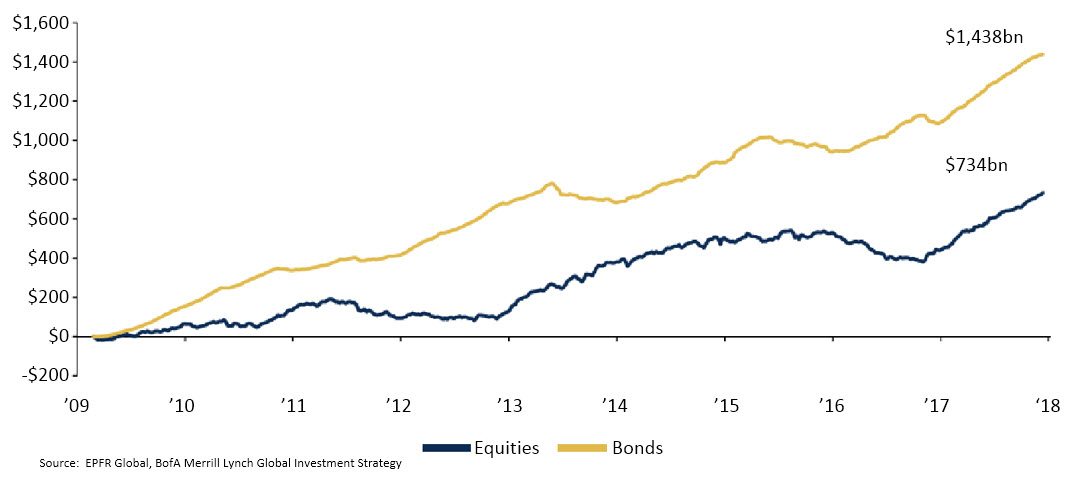
Most investors say they are long-term in their investment horizon. If this were true, investors would not have sold equities in 2009 or fail to re-invest since (the graph below shows the cumulative flows into US bond and stock funds since 2009).
In the first chart, I also highlight two periods, 1966-1983 and 2000-2013, where the equity market fell and recovered, but it took 13- and 17-years to break to new highs. The good news for investors today is that we are in the early stages of what I expect to be a long-term (10+ years) bull market.
Sentiment
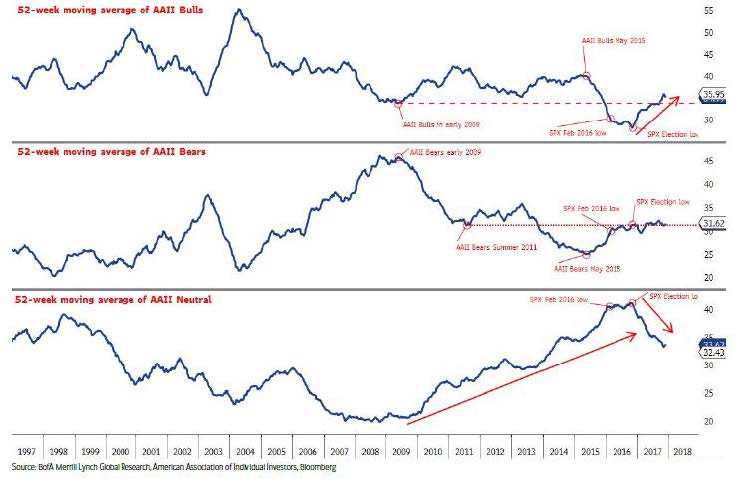
This is an aspect that is most difficult to measure, because the data are often “squishy,” as they are survey-based. There are some hard data I include, such as the put:call ratio and investor cash holdings reported by some of the banks/brokerages. Below is the AAII survey showing the percentage of investors identifying as “bulls,” “bears,” or “neutral” (no animal has been assigned to this category). Sentiment is a contrary indicator, that is, the more bullish, the greater the concern, and the more bearish, the greater the confidence. Investors are uniformly bullish at market tops and extremely bearish at bottoms. Today the various indicators all point to neutral: investors are not as bearish as a year ago, but we don’t see the extreme bullishness that marks market tops.
So, there you have it. My investment triangle says Stay Invested. Valuations are high, but momentum is positive and sentiment is neutral. I should note that this framework is but one tool in my investment kit. It’s focused on powerful market indicators, but I also spend a lot of time sifting through the economic data (which have been strong) and, more recently, considering geopolitical and socioeconomic conditions. I’ll continue to cover those topics in future posts, but for now, I wanted to share how I see the markets at the beginning of 2018. Happy new year to all!
Print this Article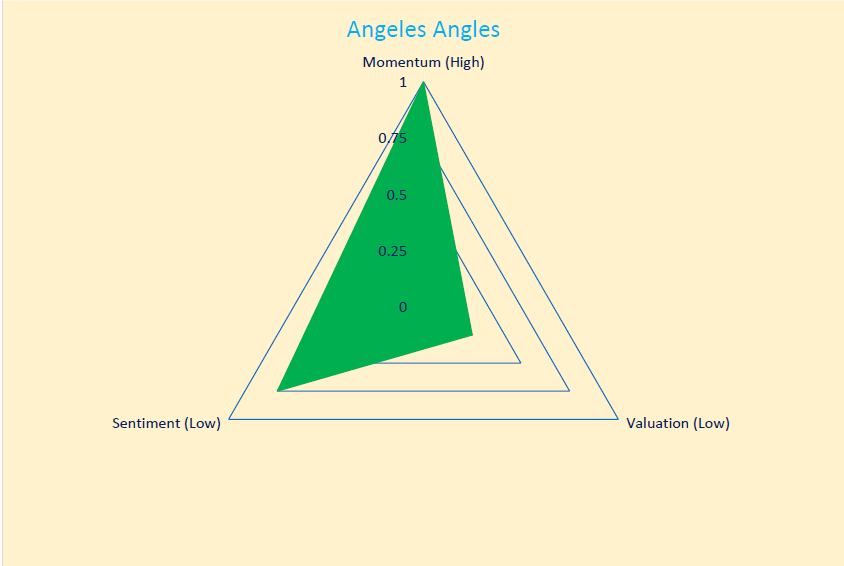
-
![Jobs]() 4 Sep, 2015
4 Sep, 2015Jobs
Markets have taken today's employment release as evidence of a weakeningÂjobs market. A mere 173,000 net new jobs ...
-
![Not Just A Game]() 10 Dec, 2020
10 Dec, 2020Not Just A Game
There are twenty amino acids in the human body. Amino acids are the chemical links that make up proteins. Proteins ...
-
![No Panic (Yet)]() 13 Aug, 2015
13 Aug, 2015No Panic (Yet)
Earlier this week, China devalued its currency 1.9% against the US dollar. On one level, this is not a big deal. China's ...
-