-
-
![Michael Rosen]()
-
CIO Insights are written by Angeles' CIO Michael Rosen
Michael has more than 35 years experience as an institutional portfolio manager, investment strategist, trader and academic.
RSS: CIO Blog | All Media
Satisfaction
Published: 08-07-2023Why does the Fed insist that low unemployment drives higher inflation? Policymakers’ imagination is being fired by useless information, and they just can’t get no….
And I’m tryin’ to make some girl, who tells me
Baby, better come back maybe next week
Can’t you see I’m on a losing streak?It’s been a long time since Mick Jagger was on a losing streak. Sadly, the same cannot be said for those who run our monetary policy.
In 1958, William Phillips, a New Zealand economist, examined the relationship between the unemployment rate and wages in the United Kingdom from 1861-1957 and concluded that there was a correlation between a reduction in the unemployment rate and a rise in wages, and vice versa. It became known as the Phillips Curve. Subsequently, Paul Samuelson and Robert Solow, two Nobel Laureates, linked wage gains with inflation, and thus the Phillips Curve became economic orthodoxy. Policymakers could now confidently tweak the economy by accepting a little higher inflation for a drop in unemployment (more jobs is always a political winner).
But a funny thing happened in the 1970s. Beginning in 1973, the inflation rate and the unemployment rate did not diverge as the Phillips Curve promised, but rose in tandem. In 1975, both data sets then fell together, and then in 1979 both rose again in lock-step, before falling together in 1983 and over most of the next four decades. The chart below shows the unemployment rate in yellow, inflation (CPI) in white, the Fed funds rate in dark blue and the growth of money supply in light blue, between 1970 and 1984.
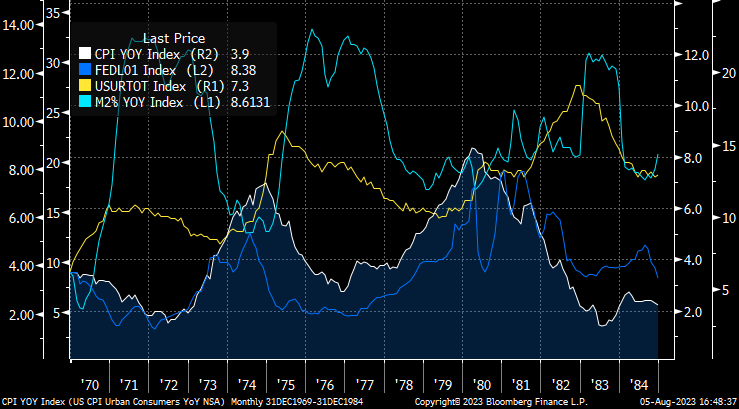
The experience of the 1970s contradicted the Phillips Curve: instead of inflation and unemployment moving opposite each other, they moved together. On hand with an explanation was Milton Friedman, another Nobel Laureate, who said that inflation was “always and everywhere” a monetary phenomenon, meaning that inflation reflected the price, or value, of money, and the price of anything is determined by its supply and demand curves. High inflation was caused by too much supply of money, as the chart above clearly shows (M2, the light blue line, surged in both the early 1970s and then again in the mid 1970s). Cut off the supply of money and inflation will fall. That is exactly what Paul Volker did in 1980, and inflation fell, just as Friedman said it would.
Following the Global Financial Crisis in 2009, the Fed slashed interest rates to zero and held it there for seven years. The Fed began raising rates in 2016, but in 2019 a mild downturn in the economy (from 3% to 2%; you have to squint to see it below, the purple line) caused the Fed to start cutting rates again.
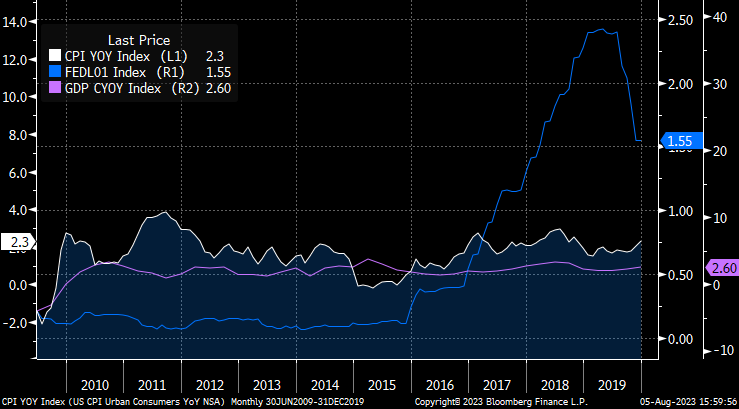
The Fed raised rates in 2016, not because it recognized that zero interest rates distorts investment decisions (which it does), but because the Fed was worried that in the next recession it would not be able to cut interest rates and so it wanted to have some cushion to do so. From 2009 through 2019, inflation averaged 1.7%, and the Fed felt that 1.7% inflation was too close to zero, and deflation, falling prices, would be difficult to manage with interest rates at zero.
It’s hard to describe just how misguided this thinking was. The “best” rate of inflation is that which does not impact investment decisions. Inflation is a tax on savers/investors, and the “best” inflation rate is therefore zero. A rate of 1.7% is not too low, yet policymakers were not satisfied with this level for fear that deflation was too close for comfort.
COVID hit in March 2020 and effectively shut down the global economy. Households and businesses hoarded cash and the Fed, appropriately, met the demand for cash by supplying more of it. But as the economy re-opened, and the demand to hold cash diminished, yet the Fed continued to supply record amounts of money. The supply of money had never exceeded 15% per year (back in the grim 1970s), yet the Fed allowed money supply to grow more than 20% in 2020 and again in 2021 (see graph below). It was this explosion in money growth that led to the highest inflation in forty years.
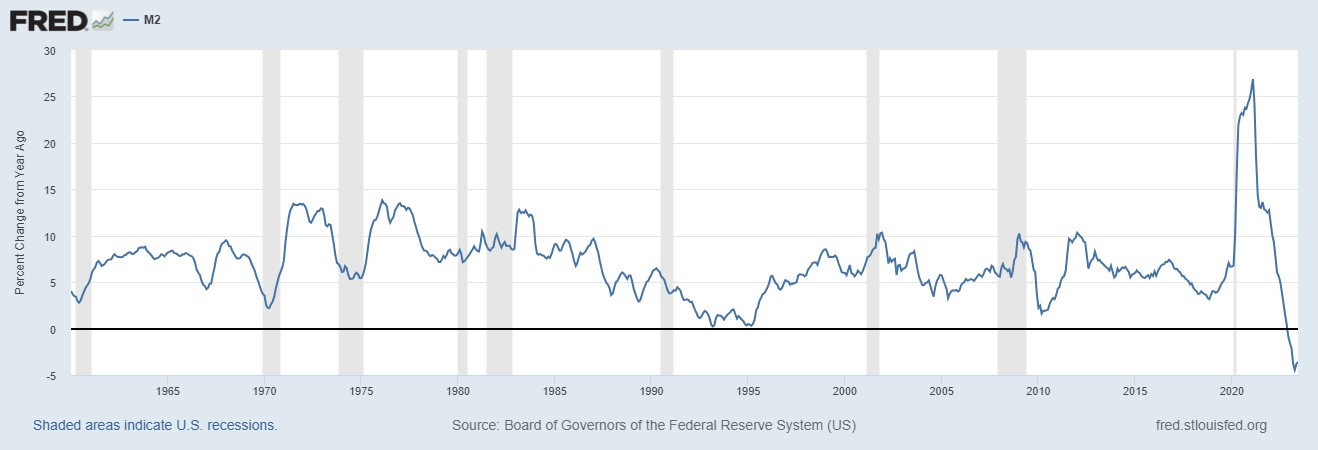
The growth of money supply peaked in February 2021 and has been contracting since December 2022 for the first time in history (well, probably since 1932). Inflation peaked in June 2022 (white line below) at 9.1% and has fallen to 3.5% in the past year. Inflation has fallen because money supply is contracting. Yet, the Fed just hiked the Fed funds rate to 5.5%; why?
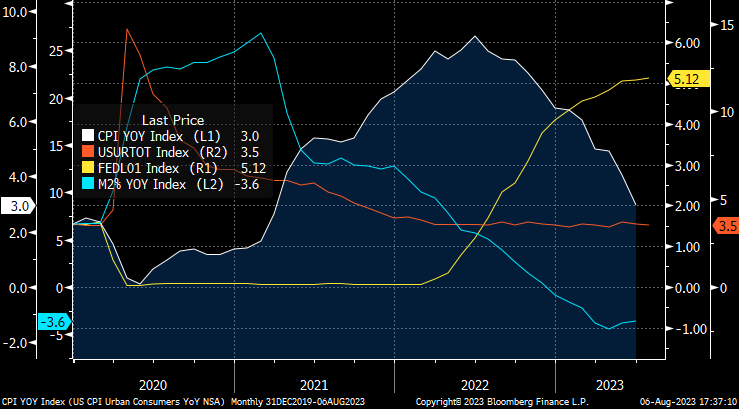
Well, apparently the new problem is that the unemployment rate is too low at 3 ½%, pushing wages higher. Back to the Phillips Curve: low unemployment = rising wages = rising inflation. So the Fed feels that it must keep rates high in order to raise unemployment, lower wages and thereby lower inflation.
The Fed is not satisfied with falling inflation and 3.5% unemployment because the Phillips Curve model does not allow for low unemployment and low inflation; remember, unemployment and inflation are supposed to move contrary to each other.
But as we have seen over the past fifty years, inflation is a monetary phenomenon. It is a function of the supply of and the demand for money. Money supply is contracting and inflation is falling.
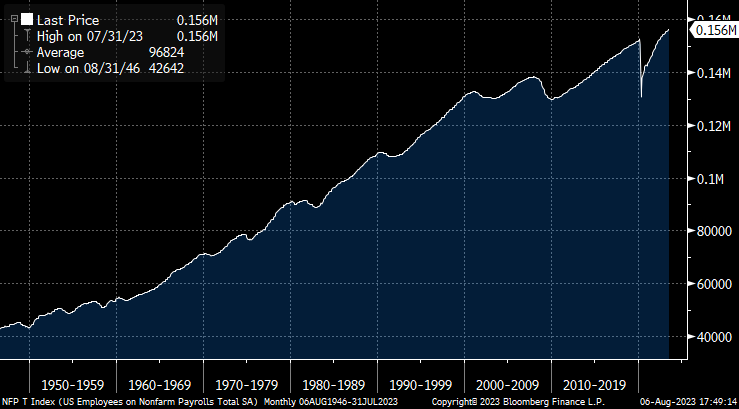
We should be celebrating that there are more than 156 million people employed in the country, the most ever (chart below).
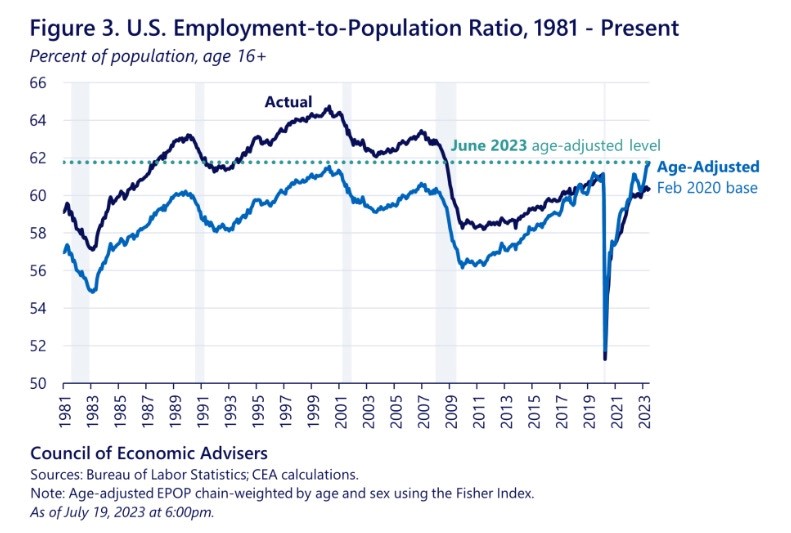
The labor force participation rate, at 62.6%, is below the February 2020 level of 63.3%, and well off its peak of 67.3% in January 2000, but this is because our population has aged. With aging, the percentage of people in the labor force will decline. Adjusted for demographics, the participation rate is actually the highest it’s been in thirty years (chart below).
The Fed is looking for dragons to slay. A low unemployment rate is not a problem, just as the 1.7% average inflation rate of the 2010s was not a problem.
The Fed was not satisfied with rising unemployment in the 1970s and thought that higher inflation would bring the unemployment level lower. Instead, it got both higher inflation and higher unemployment. The Fed was not satisfied with 1.7% inflation in the 2010s, and tried to engineer higher inflation with zero interest rates that distorted investments. Now the Fed is not satisfied with low unemployment, fearing it pushes inflation higher, despite all the evidence to the contrary that inflation is caused by the supply/demand curves of money not by the unemployment rate. It seems our policymakers are relying on the unemployment rate to justify tight monetary policy when they should be focused on money supply. It’s just as Mick said:
When I’m driving in my car
When a man come on the radio
He’s telling me more and more
About some useless information
Supposed to fire my imaginationUseless information is firing policymakers’ imagination. Rising employment and labor participation are welcomed developments, and contracting money supply is leading inflation lower. Hoping for a rise in unemployment as a means of containing inflation only means that jobs will be lost, income and wealth destroyed, and the Fed’s next policy error will push inflation higher.
Mick Jagger was not singing about the Fed, but he could have been.I can’t get no, I can’t get no
Print this Article
I can’t get no satisfaction, no satisfaction
No satisfaction, no satisfaction-
![O Pais do Futuro]() 30 Nov, 2015
30 Nov, 2015O Pais do Futuro
Charles de Gaulle (photoÂbelow)"imperious, disdainful, utterly French (and venerated for it in ...
-
![Yellow Flag]() 10 May, 2022
10 May, 2022Yellow Flag
When cars crash in an auto race, the yellow flag comes out. This requires drivers to slow down and stay in their ...
-
![Inversion]() 12 Apr, 2019
12 Apr, 2019Inversion
Say "inversion" to a Californian, and the most likely word association is layer. Its our topography that causes this ...
-