-
Investment Insight
3rd Quarter 2025 - Photograph 51
Published 10-06-2025-
2025 3RD QUARTER QUARTERLY COMMENTARY
-
PHOTOGRAPH 51
Jews arrived in England in 1066 when William, Duke of Normandy ("the Conqueror") recognized their important skills in moneylending and invited them to his new kingdom. As lucrative as this was to England's economic development, for the Jews paid the monarchy a disproportionate amount of taxes, no one likes a banker, and over the subsequent two centuries, hostility toward the Jews, both economic and religious, grew.
King Edward I of England ruled for 35 years (1272-1307) with a controversial legacy. He introduced legal reforms, known as the Statutes of Westminster, which codified property rights and established the first model Parliament (1295). He also brutally subjected the Welsh, absorbing their lands, terrorized the Scots and executed Scottish hero William Wallace (1305). He also decided to rid his kingdom of Jews. Showing unusual mercy by not killing them all, in 1290, Edward issued his Edict of Expulsion, removing all Jews from England.
The edict remained in effect until 1649, when Oliver Cromwell beheaded Charles I, ten generations removed from Edward. Cromwell rejected all previous edicts from the monarchy as illegitimate, and even when the monarchy was restored in 1660 with Charles II ascending, a small number of Jews were allowed to emigrate to England.
A century later, Parliament attempted to codify Jewish immigration and passed the Jewish Naturalization Act in 1758. But this was a step too far, and after much public protest, the law was repealed the following year. Still, a small number of Jews came to England, and some became prominent members of society. Lord Lionel de Rothschild became the first Jewish member of Parliament in 1858, and Sir Herbert Samuel was the first Jew appointed to the British Cabinet in 1909.*
Sir Herbert's grand-niece, Rosalind, was born in 1920. She had an early interest in science, and attended St. Paul's School, one of the only schools in England that taught science to girls. Rosalind went on to Cambridge University, eventually receiving a Ph.D. for her research on the porosity of coal. During World War II, Rosalind's work helped develop more effective gas masks, and her work on coal microstructures remains a foundation of material science today.
But it was her work as a photographer that brought her renown. Well, that's not entirely true. She was a scientist, not a photographer, who happened to take the most important photograph in history. And rather than renowned, her work was overlooked and ignored her entire life, despite being the foundation for the greatest scientific discovery in history. Both her work, and the neglect of her contributions, contain important lessons for us today.
The recession that has been widely anticipated for the past three years has not materialized as the economy continues to grow despite widening political polarization and economic policy incoherence. The economy's strength is testament to the resilience of households and corporate America.
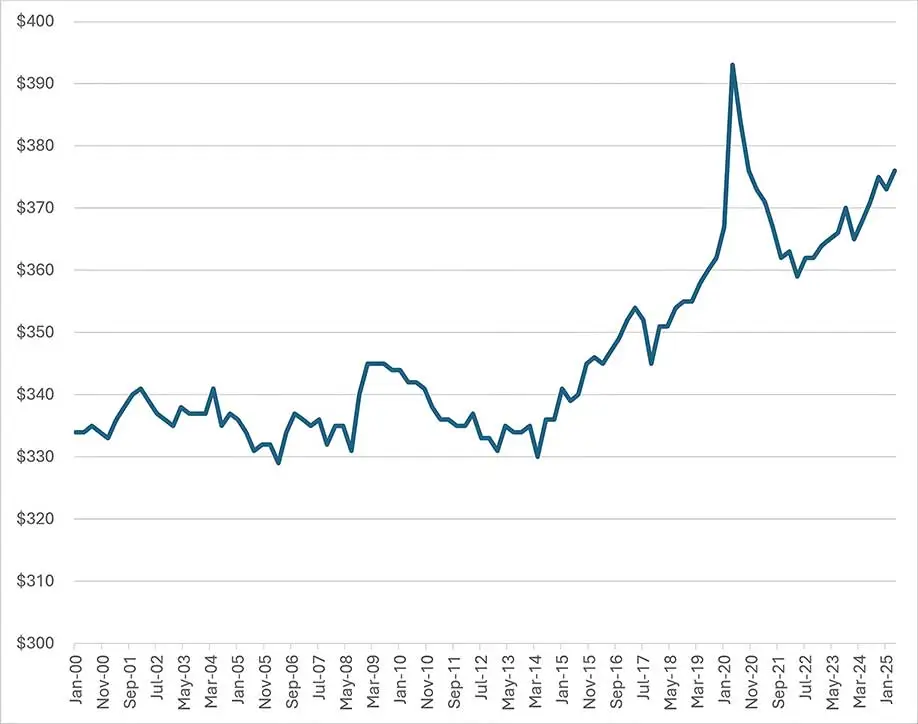
Real wages, that is, income after inflation, are up 2.2% in the past year, 14% in the past decade (Chart 1), giving consumers greater spending power.
* H.H. Asquith appointed him Postmaster General, and then Home Secretary. He was later named High Commissioner of Palestine.
- Chart 1
-
Weekly Real Wages, 2000-2025
-
-
Source: Bureau of Labor Statistics
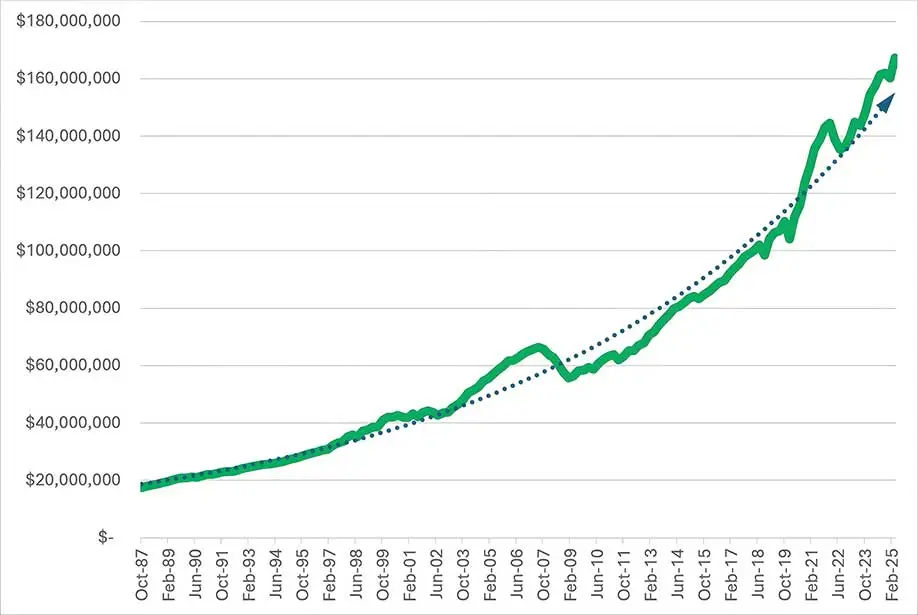
Rising incomes are bolstered by a record level of household net worth (assets minus liabilities), now a whopping $167 trillion (Chart 2). Household assets increased $61 trillion since the end of 2019, the year before the pandemic. Over the same period, liabilities rose just $4 trillion. This works out to a 51% growth in net worth in just five years. This combination of higher real incomes and record -high household wealth has propelled the US economy higher.
- Chart 2
-
Household Net Worth, 1987-2025, $ Bil.
-
-
Source: Federal Reserve System
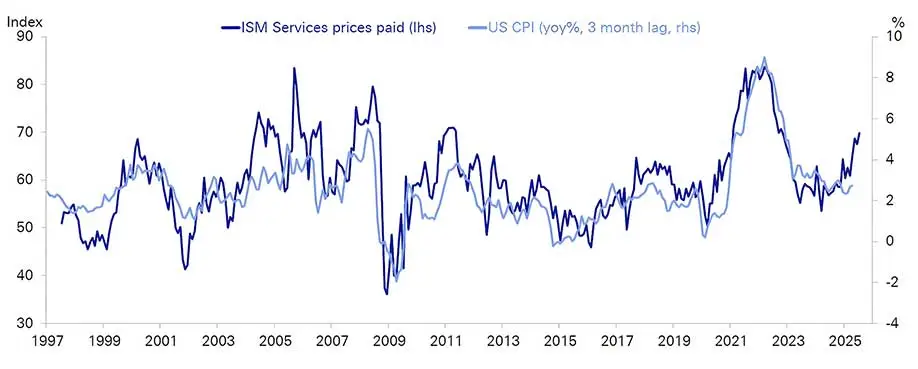
Inflation has receded to a 2.9% annual rate, but appears to want to go no lower. Wholesale prices typically lead consumer prices, and this series points to higher inflation to come (Chart 3).
- Chart 3
-
ISM Services Prices Paid and Consumer Price Index (lagged), 1987-2025
-
-
Source: Institute for Supply Management, Bureau of Labor Statistics. Courtesy: Deutsche Bank
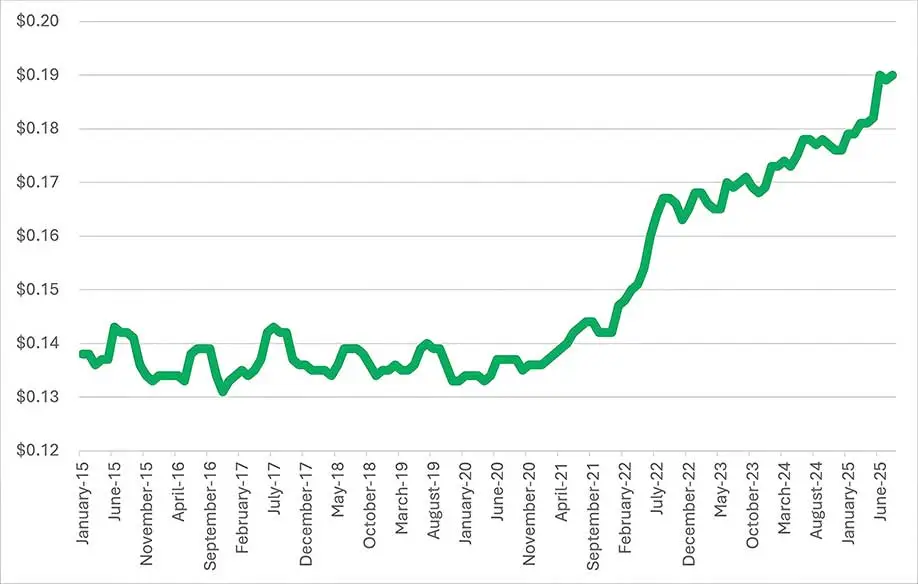
Every economy in the world would collapse without electricity. After years of little to no rise in its price, costs are now soaring, up 40% in the past five years (Chart 4). Blame AI.
- Chart 4
-
Average Price Electricity per Kilowatt Hour, US City Average, 2015-2025
-
-
Source: Bureau of Labor Statistics
In 1999, the Reserve Bank of New Zealand established a target inflation rate of 2%. It was the first central bank to do so. The 2% rate was not the result of robust modeling or analysis, but was basically pulled out of thin air. Still, it caught on, and most central banks around the world eventually adopted the same policy.
From a completely made-up number to something like religious dogma, central bankers have come to regard the 2% target as sacrosanct. This has caused major policy distortions. From the end of the Global Financial Crisis in March 2009 to the beginning of the pandemic in early 2020, inflation averaged 1.6% annually in the US. This was an apparently intolerable situation for the Fed, which worried that inflation might tip into deflation. The Fed responded by changing its policy framework** from a set inflation target of 2% to one that targeted an average inflation rate of 2%. Since inflation had been running below 2% for a decade, the implication was that the Fed would prefer to see inflation running above 2% for the coming decade. The result was inflation of 4.4%, 7.9% and 4.3% in 2021, 2022 and 2023, respectively. They got a bit more inflation than they wished for.
The point is not the failure of the Fed to keep inflation low over the past five years, although that is a good point. It is important for investors to recalibrate their future inflation assumptions. We will not return to the low inflation of the previous decade. We have entered an era of greater government involvement in the economy via industrial policy that subsidizes favored industries and penalizes others, trade policies that have upended global supply chains, and explicit attacks on the independence of the Fed to set monetary policy. All this means a less efficient economy, manifested in both weaker growth and higher inflation.
The massive accumulation of government debt through unprecedented (outside of war) budget deficits that are not expected to diminish in anyone's time frame is a powerful incentive for the government to tolerate, even favor, higher inflation. Investors should expect exactly that.
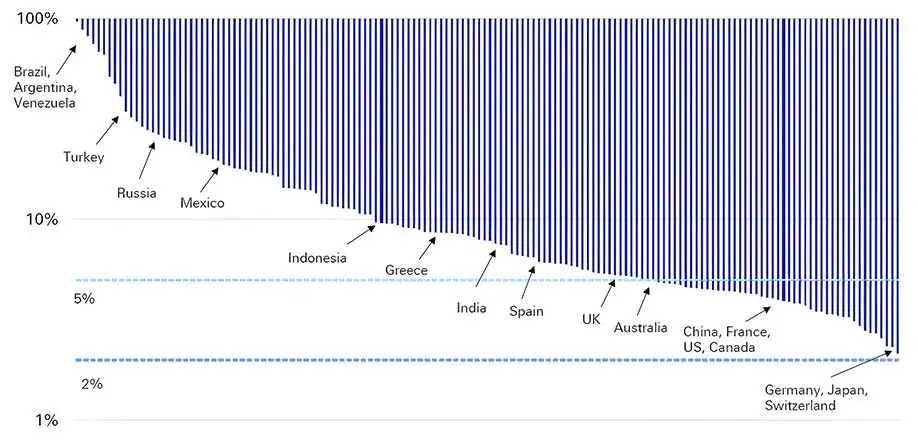
History supports the expectations of higher inflation. Since 1971, when the gold standard that was established at Bretton Woods in 1944 was abandoned, not a single country in the world has managed to hold inflation below 2%. Switzerland comes close at 2.2%, and a few Latin American countries are at the other end with close to 100% annualized inflation (Chart 5).
Again, the era of 2% inflation is over, even if the Fed won't admit it. Investors, take heed.
** "Statement on Longer-Run Goals and Monetary Policy Strategy", unanimously adopted by the Federal Open Market Committee (FOMC) on August 27, 2020.
- Chart 5
-
Average Annual Inflation of 152 Economies, 1971-2024
-
-
Source: World Bank, Courtesy Deutsche Bank
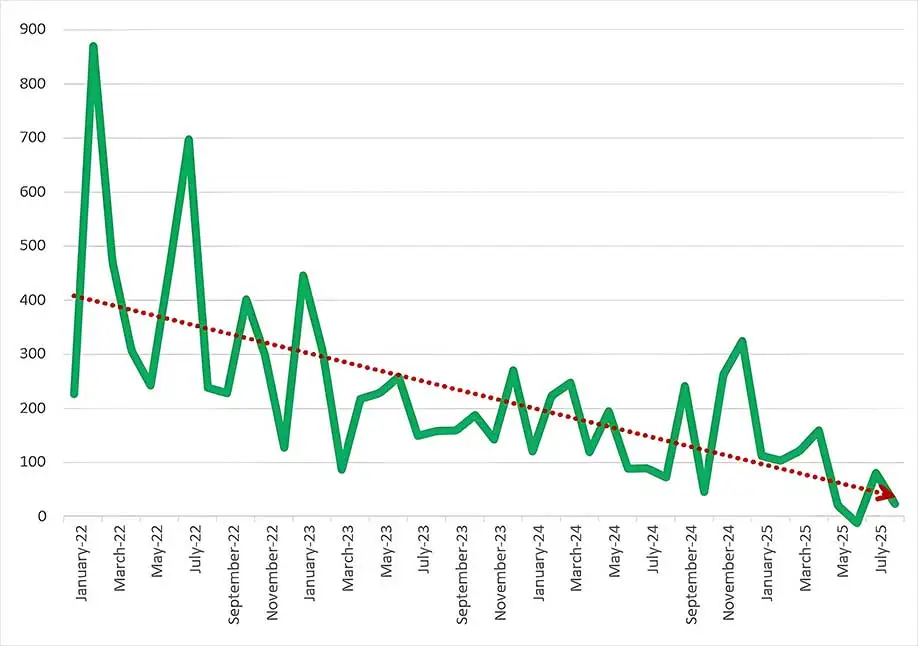
Employment growth has declined precipitously, posing a conundrum for policy makers and investors. Monthly payroll growth has fallen from 400,000 new jobs created each month to less than 100,000 today (Chart 6).
- Chart 6
-
Monthly Change in Employment, 2022-2025, Thousands of Persons
-
-
Source: Bureau of Labor Statistics
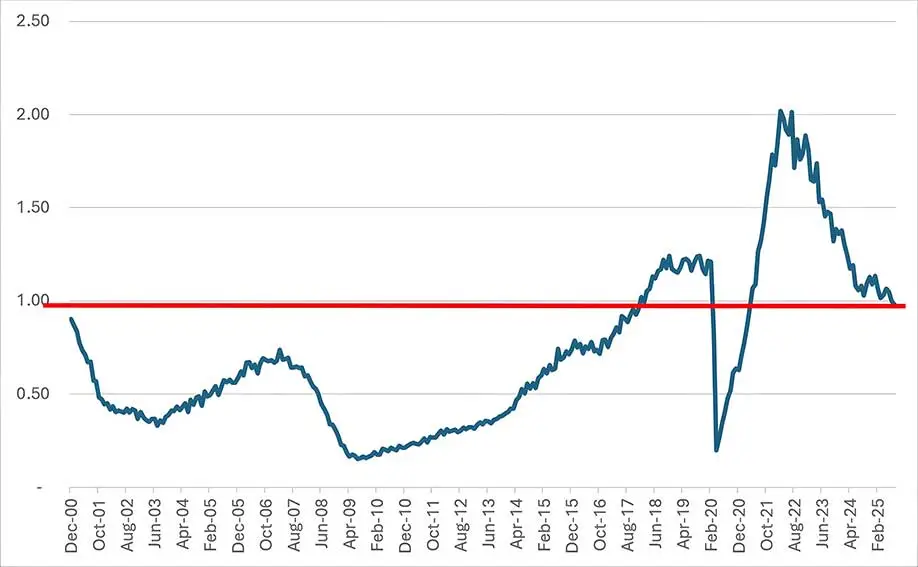
Three years ago, there were two job openings for each unemployed worker. It prompted talk of the "Great Resignation," of young Chinese adults "lying flat," refusing to work or look for work. Layoffs fell to their lowest level in at least 25 years with businesses afraid that workers could not be replaced.
Today, the labor market has become more balanced, with one job opening for every unemployed person*** (Chart 7). The question that confounds policy makers is whether the labor market has weakened structurally, or has simply returned to a more sustainable balance. The answer has implications for policy and the prospects of continued economic growth or rising risks of recession.
*** 7,227,000 job openings and 7,384,000 unemployed workers.
- Chart 7
-
Job Openings/Unemployment 2000-2025
-
-
Source: Bureau of Labor Statistics
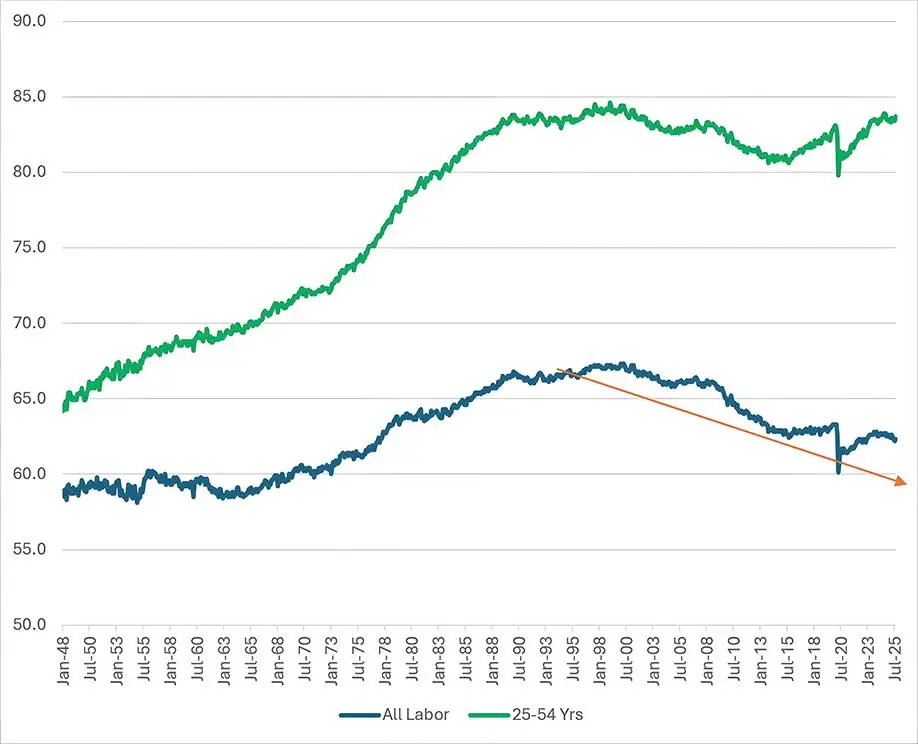
One answer comes from looking at the participation rate, the percentage of the population in the labor force. The overall participation rate has been generally declining for the past 25 years. Economic expansions tend to draw in more workers, as we saw in the pre-pandemic decade, but demographics rule, and our aging population is the cause of the falling participation rate. But when we look at the participation rate for "core" workers, those ages 25-54 years, their participation rate is near record highs (Chart 8). So one explanation for the slowing job growth is simple demographics.
- Chart 8
-
Labor Force Participation Rate, All Labor and 25-54 Yrs., 1948-2025
-
-
Source: Bureau of Labor Statistics
Immigration is an offset to declining demographics, and over the past three years four million immigrants were added to the work force, about the same number added as native born workers. Since foreign born workers comprise less than 20% of the work force, this was a large percentage shift.
This trend has reversed in the past six months. Over this period, US-born employment is up 1.3 million while foreign born employment is down by 1.4 million. The precipitous decline in foreign workers, along with aging demographics of the native population, are likely large factors in the diminishing growth rate of the labor market.
It's possible that the demand for workers is falling too, but that explanation is hard to square with other economic data. Wages are up, as we've seen, consumer spending is strong, and the unemployment rate has barely moved.**** It is very unusual to see solid economic growth simultaneous with a sharp decline in payroll growth. In fact, this has not occurred in any expansion in the past 60 years. This suggests that a shrinking pool of labor explains most of the declining rate of employment growth.
Understanding these labor dynamics is important for policy makers and investors. The Fed is embarking on a path to lower interest rates, ostensibly to offset labor weakness. Lower rates serve to stimulate demand. But if the slowdown in labor growth is not due to weaker demand but to a shrinking supply of workers, cutting interest rates will not add new workers to the labor pool. To do so when inflation remains elevated carries risks of pushing inflation even higher.
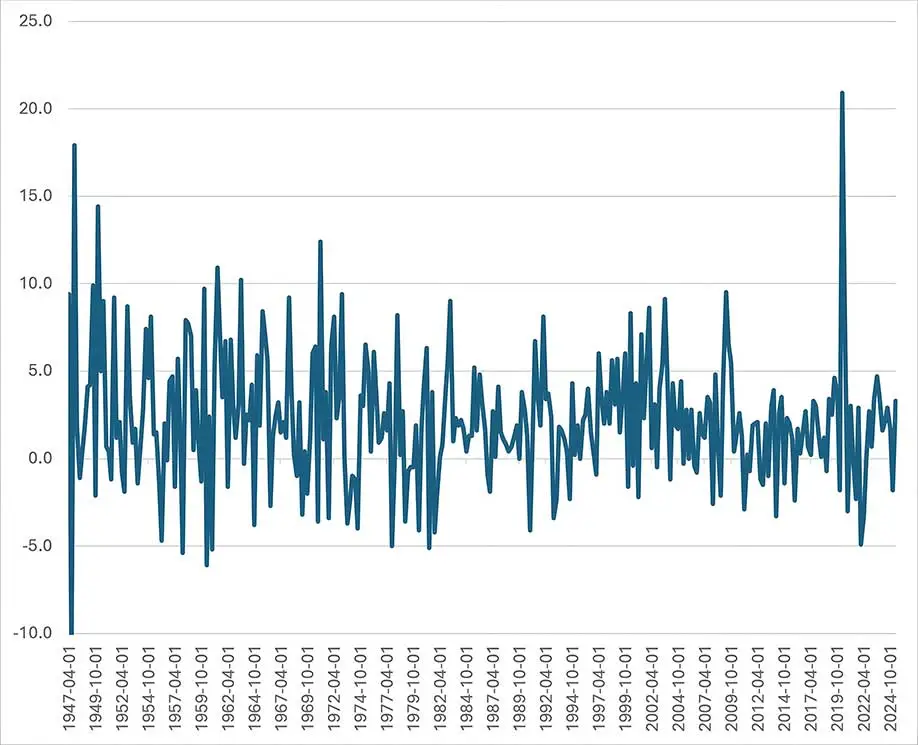
A productivity boom could also explain strong economic growth with lower employment levels, and perhaps that is coming (AI again). Productivity has picked up, and is a bit higher than its long-term average, 3.3% vs. 2.2% (Chart 9), but is not a full explanation for the conundrum of solid economic growth with slowing payroll growth. A lower supply of labor, due to demographics and a reversal of immigration, is the likely cause. Lower interest rates will do little to arrest this trend.
**** The unemployment rate was 4.2% in March and is 4.3% at the end of August.
- Chart 9
-
Labor Productivity, All Workers, 1947-2025
-
-
Source: Bureau of Labor Statistics
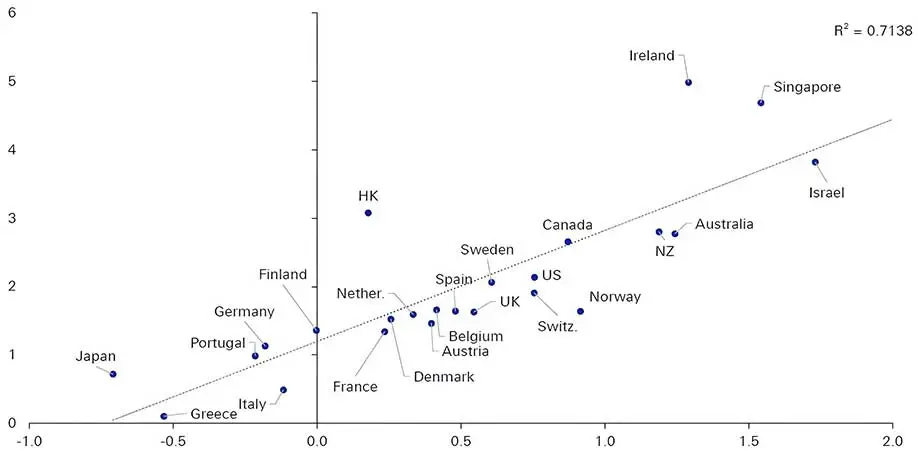
Economic growth is a function of productivity and labor force growth. Among developed economies, there is a close correlation between the growth in the labor force and GDP growth (Chart 10). A boost in productivity is the magic sauce that enables the economy to grow even as the labor pool shrinks, and we hope a productivity surge is on the horizon (AI!). Till then, GDP growth will likely slow as fewer workers are available.
- Chart 10
-
Real GDP (y-axis) and Working Age Population, Developed Economies, 2000-2024, CAGR (%)
-
-
Sources: United Nations, Courtesy: Deutsche Bank
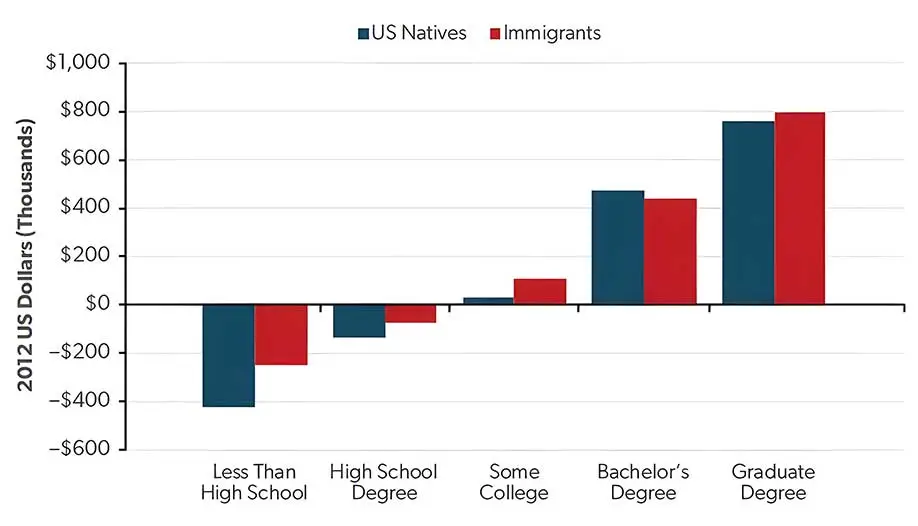
On the topic of immigration, a recent report***** makes clear that "immigrants are a net fiscal positive, contributing more in tax revenue than they use in pub¬licly provided services." This is especially true for highly educated immigrants, although across all education levels, immigrants are either less of a fiscal burden, or have a larger positive fiscal impact than native born Americans (Chart 11).
***** The Fiscal Impact of Immigration: An Update, Pia M. Orrenius, Alan D. Viard, and Madeline Zavodny, AEI, September 2025.
- Chart 11
-
Long-Run Net Fiscal Impact of Immigrants and Natives, by Education Level (2012 USD, 000)
-
-
Source: Blau, Francine D., and Christopher Mackie, eds. 2017. The Economic and Fiscal Consequences of Immigration. National Academies Press. https://doi.org/10.17226/23550.
A recent addition to immigration policy has been to raise the cost of the H-1B visa, which allows companies to bring highly skilled foreign workers to the US, to $100,000 per visa. The Lakers will be happy to pay the fee for Luka Dončić, but for the rest of the economy, this will have the (intended) effect of curtailing virtually all H-1B workers. This is a very big mistake.
We noted last quarter of the disproportionate contribution highly skilled immigrants make to the US economy in the form of patents, new business formation, even Nobel Prizes.****** But we did not mention the positive impact highly educated immigrants have on US-born workers.
A study in 2015 of rising numbers of H-1B holders from 1990-2010 found that these foreign workers contributed 30-50% of all productivity growth in the economy over these two decades. That is, nearly half the productivity gains in the entire economy can be attributed to the contributions of H-1B holders. Their presence raised the wages of American workers: "Increases in STEM workers are associated with significant wage gains for college-educated natives. Gains for non-college-educated natives are smaller but still significant.******* The study found that a 1% increase in a city's foreign tech workers caused 7-8% higher wages for college-educated workers and 3-4% higher wages for workers without any college education.
A study******** last year found that the firms that win a government lottery allowing them to hire H-1B workers produce 27 percent more than otherwise-identical firms that don't win that lottery, employing more immigrants but no fewer US natives.
Of all the policy tools available to spur innovation and productivity, raising the number of skilled and educated workers and researchers admitted into the country is highly effective. A report by leading economists in 2019 summarized it as, "In the short run, research and development tax credits and direct public funding seem the most effective, whereas increasing the supply of human capital (for example, through expanding university admissions in the areas of science, technology, engineering, and mathematics) is more effective in the long run. Encouraging skilled immigration has big effects even in the short run. Competition and open trade policies probably have benefits that are more modest for innovation, but they are cheap in financial terms and so also score highly."*********
Our world is not zero-sum, or at least, it is not if we choose to pursue positive-sum outcomes. The addition of highly educated immigrants does not take jobs from native workers or reduce the wages of Americans. The opposite has been true: more educated immigrants to the US increases wages and creates more jobs for American workers.
The reason for this is that innovation is spurred by collaborating with a broad and diverse group of colleagues. The Human Genome Project (1990-2003) involved more than 20 research institutions from around the world. The Manhattan Project (1942-45) brought together more than 130,000 scientists and workers across the US, Britain and Canada. The Apollo Program (1961-72) had over 400,000 engineers and scientists working together.
America has led the world in innovation for a century, due in large part to the millions of immigrants that have helped to unleash new insights, discoveries and products that have transformed the world. Which is where we return to Rosalind.
****** https://www.angelesinvestments.com/insights/investment-insights/2nd-quarter-2025-seed-bank.
******* Giovanni Peri, Kevin Shih, and Chad Sparber, STEM Workers, H-1B Visas, and Productivity in US Cities, Journal of Labor Economics, July 2015.
******** Parag Mahajan, et.al., The Impact of Immigration on Firms and Workers: Insights from the H-1B Lottery, Institute of Labor Economics, April 2024.
********* Nicholas Bloom, John Van Reenen, and Heidi Williams, A Toolkit of Policies to Promote Innovation, Journal of Economic Perspectives, Summer 2019.
X-ray diffraction imagery is very different from the more familiar X-rays that show the shadows of bones, for example. Diffraction scatters the X-rays from the target molecule, and these X-rays combine in a process called interference to reveal the repeating patterns in the molecular structure.
Rosalind, along with her Ph.D. student, Raymond Gosling, at King's College, London was using X-ray diffraction to examine strands of DNA. Each strand was less than 1 mm thick and contained hundreds of thousands of similarly oriented molecules. She directed the X-rays at the DNA molecules perpendicular to their long axis.
She and Gosling took dozens of photographs, each one with varying degrees of humidity. The 51st photograph, taken in early May 1952, was exposed to X-rays for 62 hours and was the clearest of them all. The cross, which is so visible, suggested that the strands of DNA were formed in a helical structure.
Rosalind put Photograph 51 aside, but returned to it in early 1953. In March of that year she drafted a paper that proposed that DNA was formed in a helical structure, most likely a double helix with ten bases per turn on the inside and phosphate groups on the outside. She deduced from the absence of the fourth spot of each arm of the helix that the two chains would be separated by 3/8ths of the pitch of the double helix. All of this was correct.
Rosalind had decided to leave King's College for a position at Birkbeck College, and her student Gosling was assigned to her colleague, Maurice Wilkens. Wilkens reviewed Gosling's work with Rosalind and was struck by the clarity of Photograph 51. Without Rosalind's knowledge or consent, he shared it with his colleagues James Watson and Francis Crick, who used the photograph and her calculations to build a model of DNA themselves.
Watson and Crick's paper with the double helix model of DNA appeared in Nature in 1953, alongside Rosalind Franklin's paper and Photograph 51. The effect was astounding, as scientists around the world immediately recognized that the structure of DNA had been discovered. It was the beginning of the genomic revolution that transformed our understanding and treatment of genetics.
Watson and Crick were quick to take public credit for discovering the double helix structure of DNA and implied that Photograph 51 merely confirmed their model, when in fact, it was the critical piece of evidence that unlocked the secrets of DNA, evidence they obtained without her knowledge or consent.
Rosalind Franklin was relegated to a footnote in the exhilarating story of how the boy wonders, Watson and Crick, discovered the structure of DNA. In 1962, the two of them, along with Maurice Wilkens, were awarded the Nobel Prize in Physiology. Sadly, Rosalind Franklin had died in 1958, at the age of 37, of ovarian cancer. She was not honored posthumously, nor was her contribution even mentioned by either the Nobel committee or by the honorees.
Her invaluable contributions to science have never been adequately recognized. Francis Crick died in 2004, but later in his life did acknowledge that her work was essential to theirs. Watson denigrated her work for years, although eventually conceded that he had been unfair in diminishing her contributions. He is still alive at 97, and it is not too late for him, for the Francis Crick Institute in London, or for the Nobel committee to acknowledge their errors in neglecting her.
Likewise, King Edward's Edict of Expulsion has never formally been repealed. It clearly has not been enforced, but after more than 700 years, it's also not too late for the British Parliament to officially reject this hateful act.
As investors, we must be diligent in correcting our mistakes. Not only for moral reasons, but also for the negative financial consequences we will suffer otherwise.
Likewise, we must also acknowledge that success in whatever endeavor we pursue is dependent on collaboration with our colleagues. By embracing and harnessing their diverse skills and perspectives, we elevate our own work.
We must condemn and correct errors of the past, no matter how much time has passed, and we should welcome a growing and diverse group of colleagues to spur creativity, productivity and innovation. Our future depends on it.
-
![Michael Rosen]()
-
Michael A. Rosen
Principal & Chief Investment Officer
Michael Rosen, co-founder and Chief Investment Officer of Angeles Investments, has 37 years of experience as an institutional portfolio manager, investment strategist, and investment consultant.
Please see more insights from Michael Rosen and Angeles here:
www.angelesinvestments.com/insights/home -
October 2025
Connect with us
![Angeles on Linked In]()
Founded in 2001, Angeles is a multi-asset investment firm, building customized portfolios for institutional and private wealth investors.
This report is not an offer to sell or solicitation to buy any security. This is intended for the general information of the clients of Angeles Investment Advisors. It does not consider the investment objectives, financial situation or needs of individual investors. Before acting on any advice or recommendation in this material, a client must consider its suitability and seek professional advice, if necessary. The material contained herein is based on information we believe to be reliable, but we do not represent that it is accurate, and it should not be relied on as such. Opinions expressed are our current opinions as of the date written only, and may change without notification. We, along with any affiliates, officers, directors or employees, may, from time to time, have positions, long or short, in, and buy and sell, any securities or derivatives mentioned herein. No part of this material may be copied or duplicated in any form by any means and may not be redistributed without the consent of Angeles Investment Advisors, LLC.
If you would like, please click this link to receive a copy of our Form ADV Part 2A free of charge. -