-
-
![Michael Rosen]()
-
CIO Insights are written by Angeles' CIO Michael Rosen
Michael has more than 35 years experience as an institutional portfolio manager, investment strategist, trader and academic.
RSS: CIO Blog | All Media
How The Mighty Fall
Published: 11-11-2014Between March 2000 and October 2002, the NASDAQ Index fell 75%, from over 5,000 to under 1,300. Of course, valuations were beyond silly at the peak, and I confess, following the collapse, I thought my children might one day see the index surpass its previous high.
Well, 12 years later, the NASDAQ is within 10% of its 2000 high. It’s not there yet, and it’s been a long slog to recovery, but it’s getting there.
The chart below, from Barron’s, shows the largest constituents then and now. The top 5 in 2000 still around, but 6-10 have all disappeared, either acquired or taken private. A good reminder how hard it is to stay on top.
Print this Article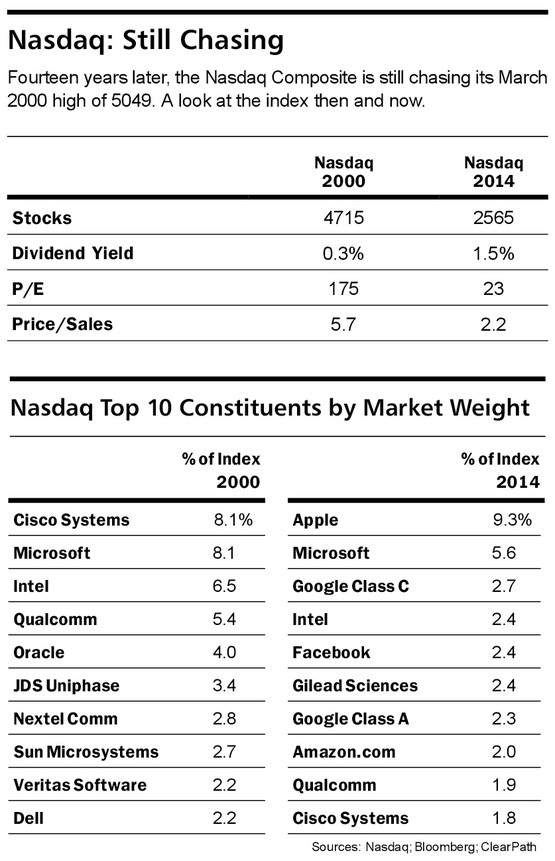
-
![Floating Oil]() 24 May, 2016
24 May, 2016Floating Oil
Oil has had a nice recovery this year (see graph for Brent, YTD), up about 18% to over $48/barrel today. Of course, this ...
-
![EM Thoughts...Not There Yet]() 25 Nov, 2014
25 Nov, 2014EM Thoughts...Not There Yet
Successful investing is frequently about balancing valuation with growth prospects. We would all love to invest in cheap ...
-
![Trade]() 7 May, 2015
7 May, 2015Trade
The trade deficit ballooned in March to over $51 billion, $8.6 billion more than a year ago. Exports were up a little, ...
-