-
-
![Michael Rosen]()
-
CIO Insights are written by Angeles' CIO Michael Rosen
Michael has more than 35 years experience as an institutional portfolio manager, investment strategist, trader and academic.
RSS: CIO Blog | All Media
California Dreamin'
Published: 04-02-2015Well, maybe not dreaming, but some thoughts.
Below, my graph shows the unemployment rates for California and the US since 1976. California was generally better than the country in the 1980s, and has trailed ever since.
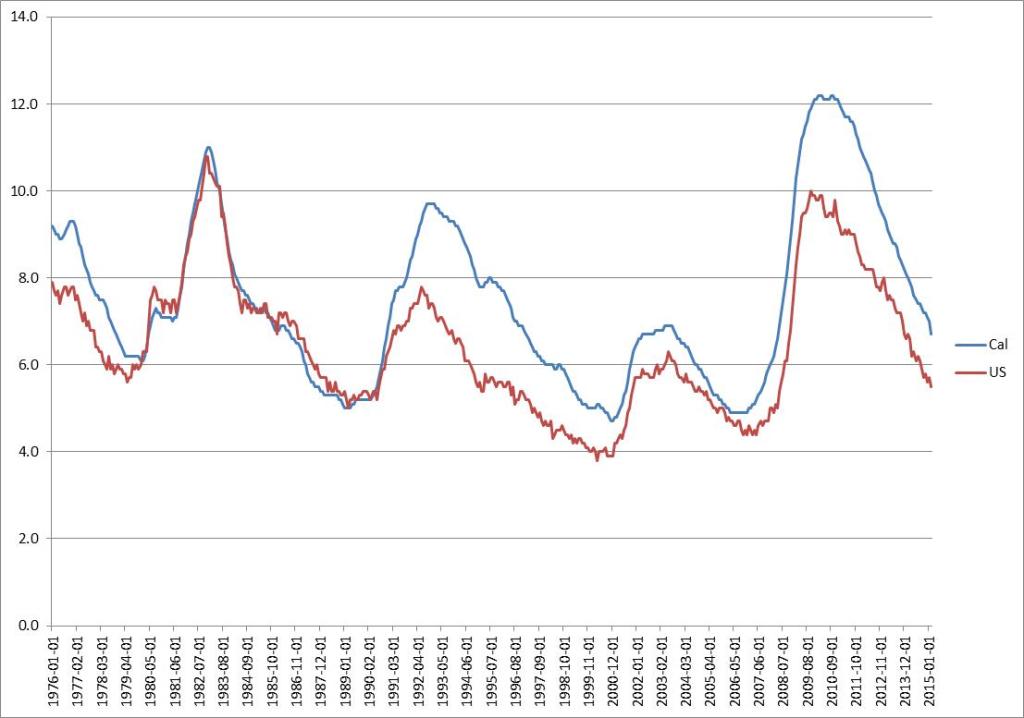
By my calculations, the US unemployment rate averaged 6.5% over the past 40 years, while the California unemployment rate averaged 7.5%, a full percentage point higher (on average, every year, for 40 years!). That is an enormous (many millions of people) cumulative shortfall in employment.
The graph raises two questions for me: what changed in 1990? and why has the job deficit persisted? The answer to the first question is pretty clear, especially for those of us who lived through that early period. The recession of 1990-91 hit California especially hard as the then-largest industry in southern California, defense, was eviscerated. Tens of thousands of highly skilled engineers and technicians, the people who literally made the US military into the most powerful force in the world, were thrown out of work that would never return.
The second question is more problematic, both because the answer is more complex, and because its implications are more important. It is beyond the scope of this blog (primarily because of the limitations of my intellectual capacity) to delve into this very complicated issue. But, it seems to me, every citizen of this state should ask why the state unemployment rate has been higher than the national average every single year for the past 25 years. I suspect taxes and regulations have something do with this, but there are, no doubt, other factors too.
My final point on this graph (at least, for today) is that the most recent recession also hit California harder than the rest of the country. The national unemployment rate peaked at 10% for one brief month (October 2009), whereas the state unemployment rate stayed above 12% in the fourth quarter of 2009 and for the entire year of 2010.
The good news, is that the unemployment rate has dropped an identical 45% from the peaks for both the state (12.2% to 6.7%) and the nation (10.0% to 5.5%). So while California bled more, the pace of jobs recovery has equaled the rest of the country. Let’s stop on that happy note.
Print this Article-
![Two (Percent) is a Sad Number]() 21 Sep, 2020
21 Sep, 2020Two (Percent) is a Sad Number
Last month, the Federal Reserve unveiled its new monetary framework, following an intensive 18-month review. The ...
-
![New Owners]() 1 Apr, 2015
1 Apr, 2015New Owners
A few years, I was at a conference, standing in a buffet line. I must have become fixated on extracting the blueberries ...
-
![Toes in the Sand]() 20 Jul, 2017
20 Jul, 2017Toes in the Sand
For me, and I think I speak for everyone on the planet, the feeling of warm sand between the toes is one of lifes great ...
-