-
Investment Insight
2nd Quarter 2023 - Foxy
Published 07-06-2023-
2023 2ND QUARTER QUARTERLY COMMENTARY
-
FOXY
Archilochus, born around 680 BCE on the Greek island of Paros, was marked for greatness at an early age. The legend is that his father sent the boy to fetch a cow in the pasture. On the way, he encountered a group of women who vanished with the cow but left behind a lyre. They were the Muses, goddesses of music, poetry and the arts, and the lyre was their sign that they had chosen Archilochus as their protégé.
True, or not, Archilochus became one of the great poets in Greek literature, indeed, in all of history. Before Archilochus, poems were either epic, that is, lengthy, detailed narratives of past events, like Homer's The Iliad and The Odyssey, or odes, lyric poems often sung that praised a person or an achievement.
Archilochus was the first to write poetry of self-reflection, of emotions. His poems were in a completely different meter than classical poetry*, and he was the first to construct elegies, poems of lament. Archilochus was praised in his time and by the generations that followed, including Aristotle, as one of the giants of Greek literature, along with Homer and Hesiod.
He was a warrior, both with pen and sword. It was said that a man named Lycambes agreed to wed his daughter Neobule to Archilochus, but then reneged on the marriage. Archilochus directed such eloquent poetic abuse at Lycambes and his family that they all committed suicide under the onslaught of his words.
Archilochus fought for his island of Paros in various wars, unthinkable for a poet then to do so, and died in battle against the island of Naxos. As a veteran of wars, he left us in one fragment the wisdom, "In victory do not brag, in defeat do not weep."
We have only fragments of his poetry, and his greatness comes from the praise of the ancient Greeks. It was one fragment of poetry by which he is best remembered today. But modern fame would only come 2,500 years later when a famous philosopher wrote about this fragment. That essay, written for fun and not meant to be taken seriously, nonetheless became that philosopher's most famous work, offering, among other things, an insight for successful investors.
* Iambic rather than hexameter.
Recession is coming, recession is coming! cry the prognosticators who pervade the airwaves with plausible, albeit selective, data of an impending, ominous economic downturn that no doubt mirrors the moral decay that has infiltrated our society. Mounting evidence is found in the employment picture, in the credit markets, and in the manufacturing data.
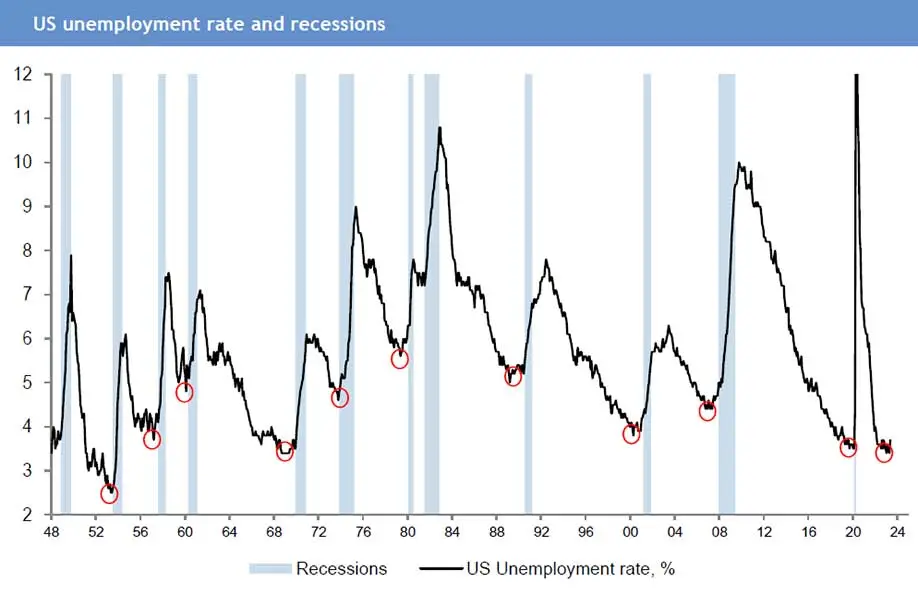
The employment picture is as strong as it has been in 75 years, with an unemployment rate of 3.7%. That's the problem: historically, when the labor market cannot get any stronger, it gets weaker, and that upturn in the unemployment rate always precedes a recession (Chart 1). In other words, the employment picture is so good, it can only get worse.- Chart 1
-
US Unemployment Rate and Recessions, 1948-2023
-
-
Courtesy: J.P. Morgan
A mitigating factor to this argument is the shifting demographic trends. In 1947, there were 43 million people in the labor force; today there are 156 million, a record high. The post-war era was characterized by both a baby boom and an upsurge in immigration*. These favorable demographic trends have reversed, restricting the size and growth of the labor pool. Employers may be slower to lay off workers knowing it will be more difficult to hire in the future, thus limiting the rise in the unemployment rate.
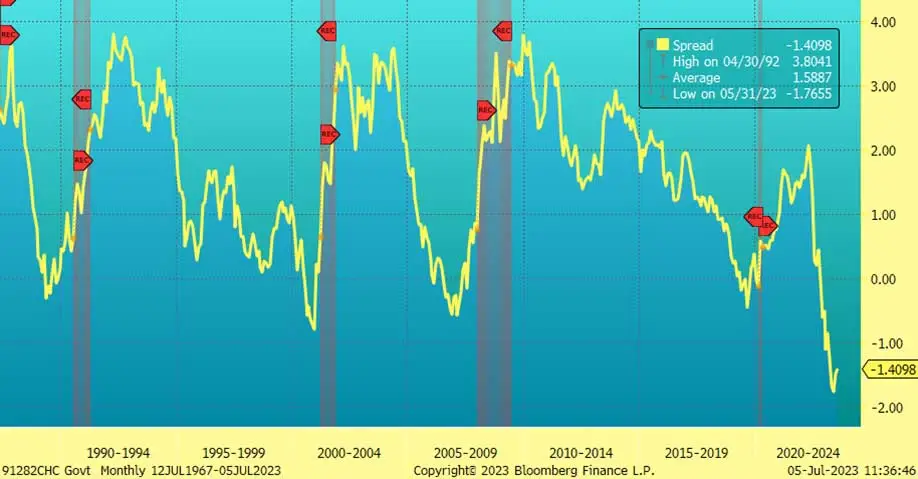
The yield curve has long been a favorite recession predictor. An inverted curve, where long-term yields are below short-term yields, is indicative of a tight monetary policy that restricts the availability of credit, thus contracting economic activity. Today the curve is as steeply inverted as it has been in 50 years (Chart 2).
* Immigration surged following the passage of the Immigration and Nationality Act of 1965.
- Chart 2
-
US Treasury Yield Curve, 10Yr – 3Mo, 1987-2023
-
-
Source: Bloomberg Finance L.P.
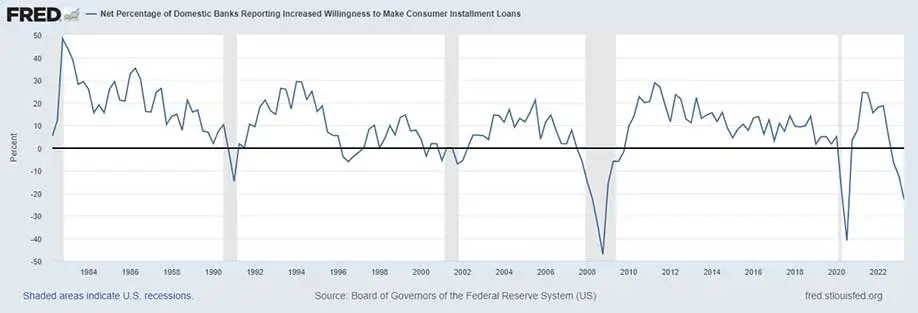
On cue, banks are tightening lending standards, as they have done before each recession (Chart 3).
- Chart 3
-
Percentage of Banks Willing to Lend to Consumers, 1982-2023
-
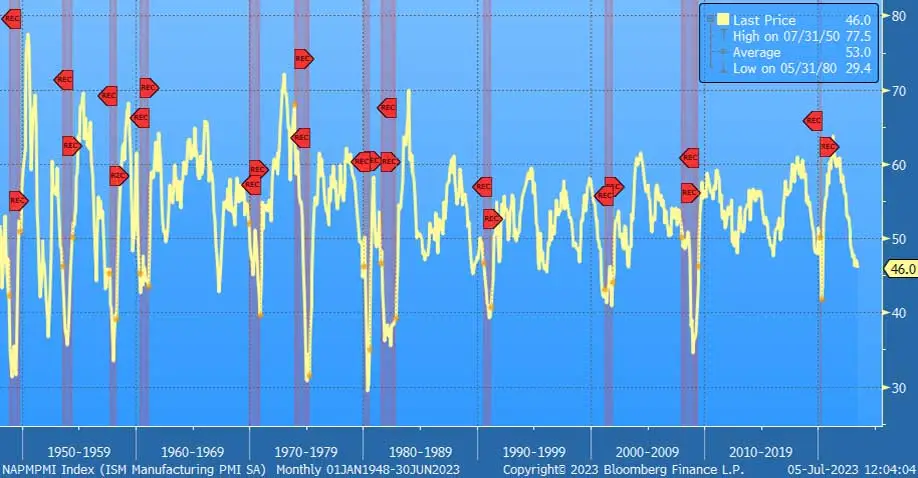
Likewise, the manufacturing sector is contracting, as the monthly survey of purchasing managers quantifies, suggesting a recession is looming (Chart 4).
- Chart 4
-
ISM Manufacturing PMI, 1948-2023
-
-
Source: Bloomberg Finance L.P.
Indeed, not only is a recession looming, but we may face a prolonged period of stagflation, stagnant growth with persistent high inflation, due to three broad factors: debt, demographics and a scarcity of resources.
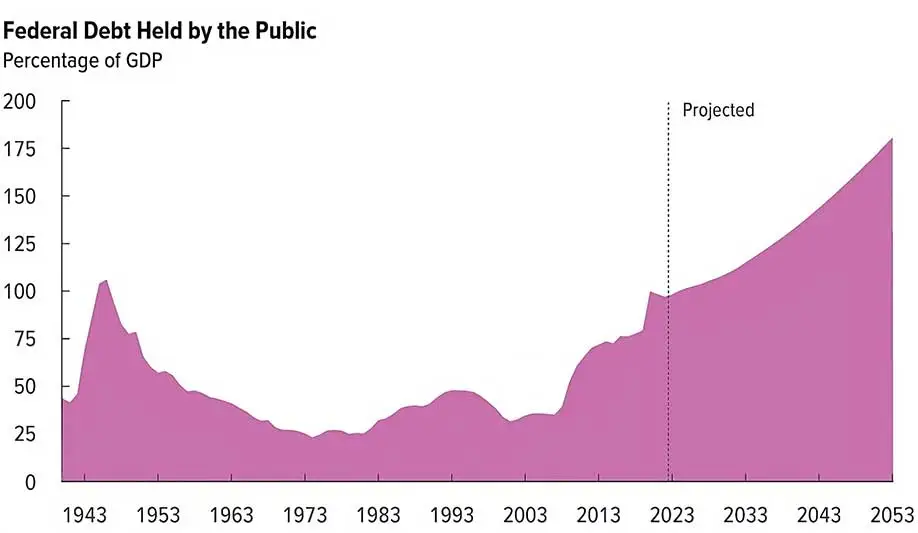
Our national debt has risen to levels only seen in the Second World War, now equivalent to 98% of GDP. The Congressional Budget Office projects the debt to rise to 181% of GDP over the next 30 years, (Chart 5) although that is their optimistic outlook; it could very well be well above that. Debt service will demand a larger share of the federal budget, squeezing out all other areas of spending.- Chart 5
-
Federal Debt as a Percentage of GDP, 1943-2053
-
-
Source: The 2023 Long-Term Budget Outlook, Congressional Budget Office, June 2023
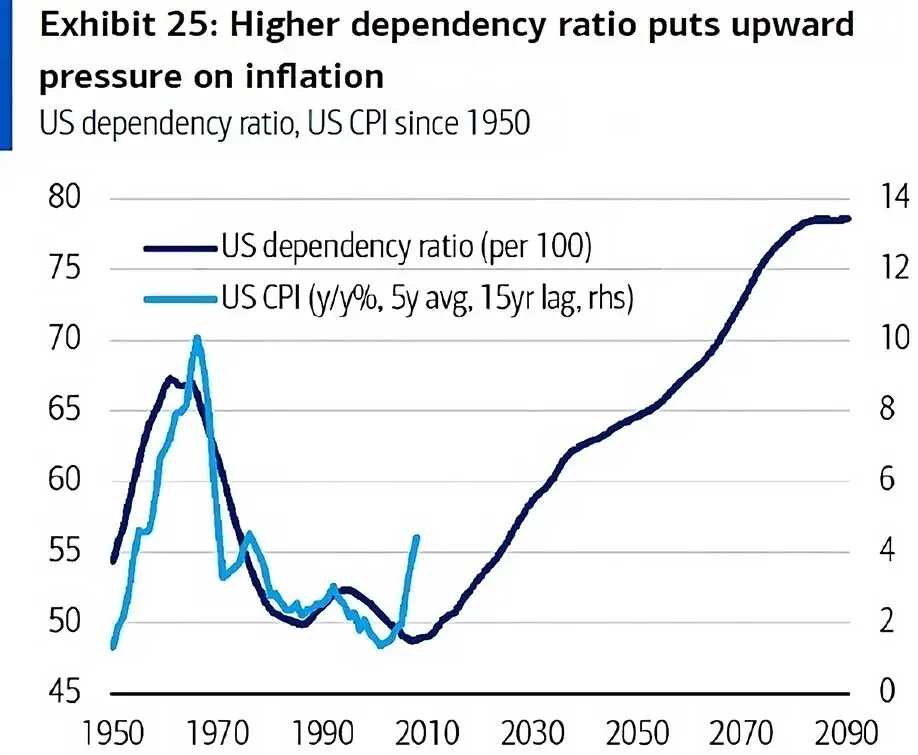
Demographic trends and restrictive immigration policies will limit the available pool of workers, thus dampening economic output and growth. We are also aging, and a higher dependency ratio* is associated with higher inflation (Chart 6).
* The dependency ratio is a measure of the number of dependents aged zero to 14 and over the age of 65, compared with the total population aged 15 to 64.
- Chart 6
-
US Dependency Ratio and CPI, 1950-2090 (projected)
-
-
Source: BofA
Labor is one area of scarcity; energy and minerals another. As we electrify our energy matrix, the demand for certain metals is increasing exponentially. Lithium, cobalt, nickel and numerous rare earth metals are all required for our future electric needs, and many of these are in short supply and/or located in politically unfriendly countries. Even energy and minerals that are abundant in the United States are difficult to extract due to self-inflicted obstacles.
For example, we have limited or prohibited the exploration and production of domestic oil and gas which has caused us to import more supplies from abroad, including from countries under US sanctions*. Meeting the goals of the (grossly misnamed) Inflation Reduction Act will require doubling the production of copper over the next decade. But permitting a new mine takes five-to-seven years and an average of another six years of litigation before the mine is operative. Even if more copper could be produced domestically, there is no capacity to process the ore. There were once 17 smelters in the US and now there are two, so we send our ore to China for processing. The last big oil refinery in the US was built in 1976**. These are the consequences of the choices we have made.
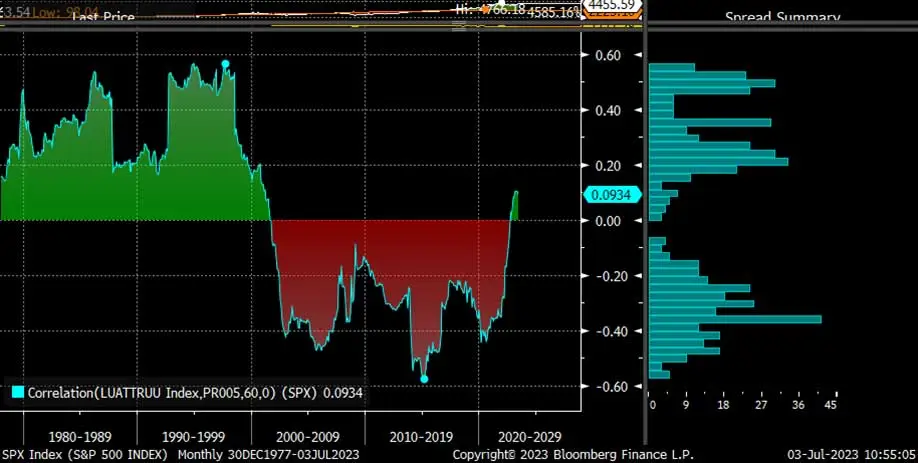
Investors may face an extended period of stagnant real returns with a conventional investment strategy. The traditional allocation of 60% stocks/40% bonds worked well for most of the past forty years. But this was a period characterized by declining inflation and interest rates, and generally negative correlations between stocks and bonds, trends that have now reversed (Chart 7).
* Venezuela, for example.
** In Garyville, Lousiana.- Chart 7
-
Monthly Correlation, S&P 500 Index and Treasury Index, 1977-2023
-
-
Source: Bloomberg
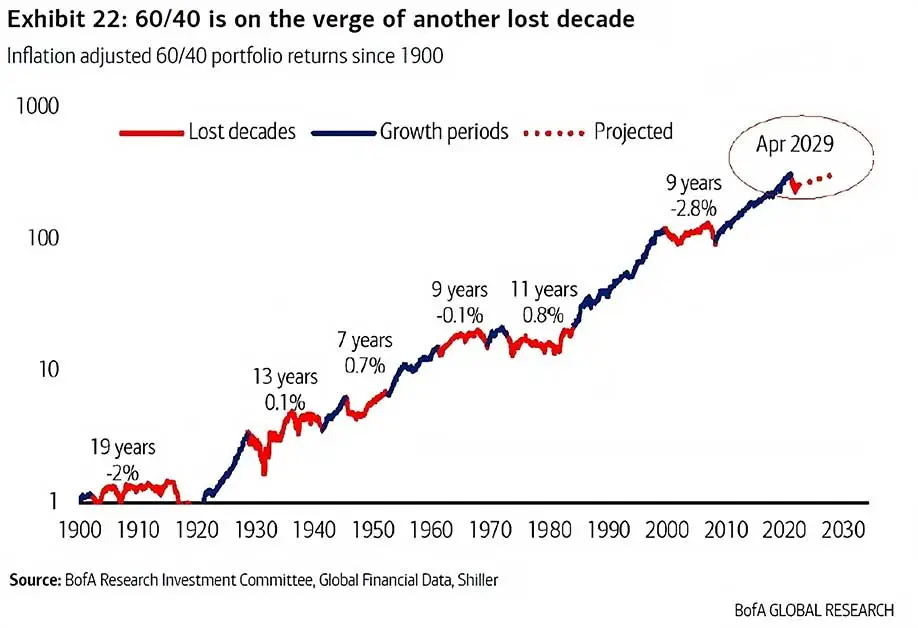
Inflation takes a big bite out of investors' returns. The past forty years saw long periods of strong performance with this traditional strategy, but over the past century, there have been numerous multi-year intervals where investors earned nothing after inflation (Chart 8). These tend to coincide with major disruptions (wars, embargoes, bubbles, pandemics?).
- Chart 8
-
Inflation-adjusted 60/40 Portfolio Returns, 1900-2023
-
-
Source: BofA
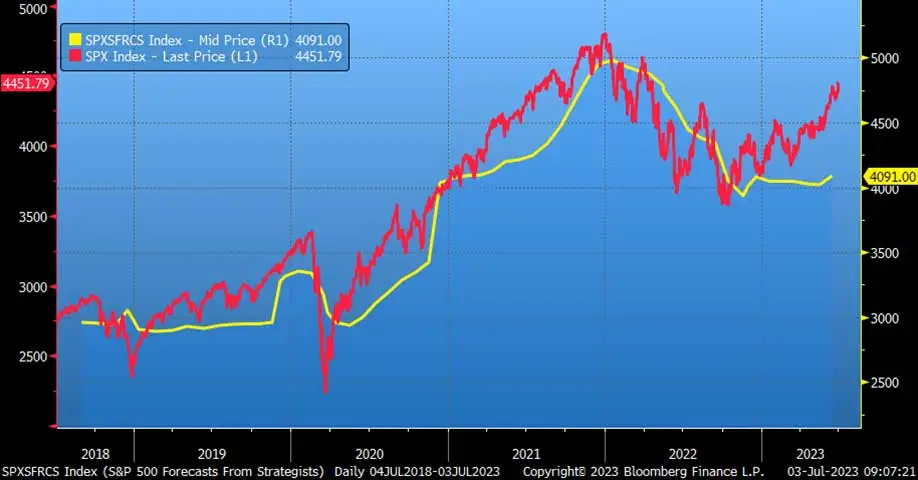
Forecasts really should be viewed with caution, including those forecasts above. Chart 9 shows the S&P 500 Index (red) and the consensus estimates* for where the index will be at year-end (yellow) over each of the past five years. The current consensus is that S&P 500 will end the year at around 4100 (it's currently over 4400), with a wide range of estimates, from 4750 on the high-end (Tom Lee at Fundstrat) to a low of 3225 (Michael Kantrowitz of Piper Sandler). It's pretty clear that analyst estimates are lagging indicators of the market, not leading ones, so take them judiciously.
* Bloomberg survey of 24 investment strategists
- Chart 9
-
S&P 500 Index and Consensus Forecasts, 2018-2023
-
-
Source: Bloomberg Finance L.P.
We laid out the case for a recession to occur in the near-term, but should point out that economists have been calling (incorrectly) for a recession for the past year. At the beginning of this year, the Congressional Budget Office projected that the US economy would show no growth (0.1% was the estimate) in 2023; so far the economy has grown at a 2% pace. The CBO projected that PCE inflation would fall this year to 3.3% (it is running at 4.6%) and that the unemployment rate would rise to 5.1% (3.7% was the last reading).
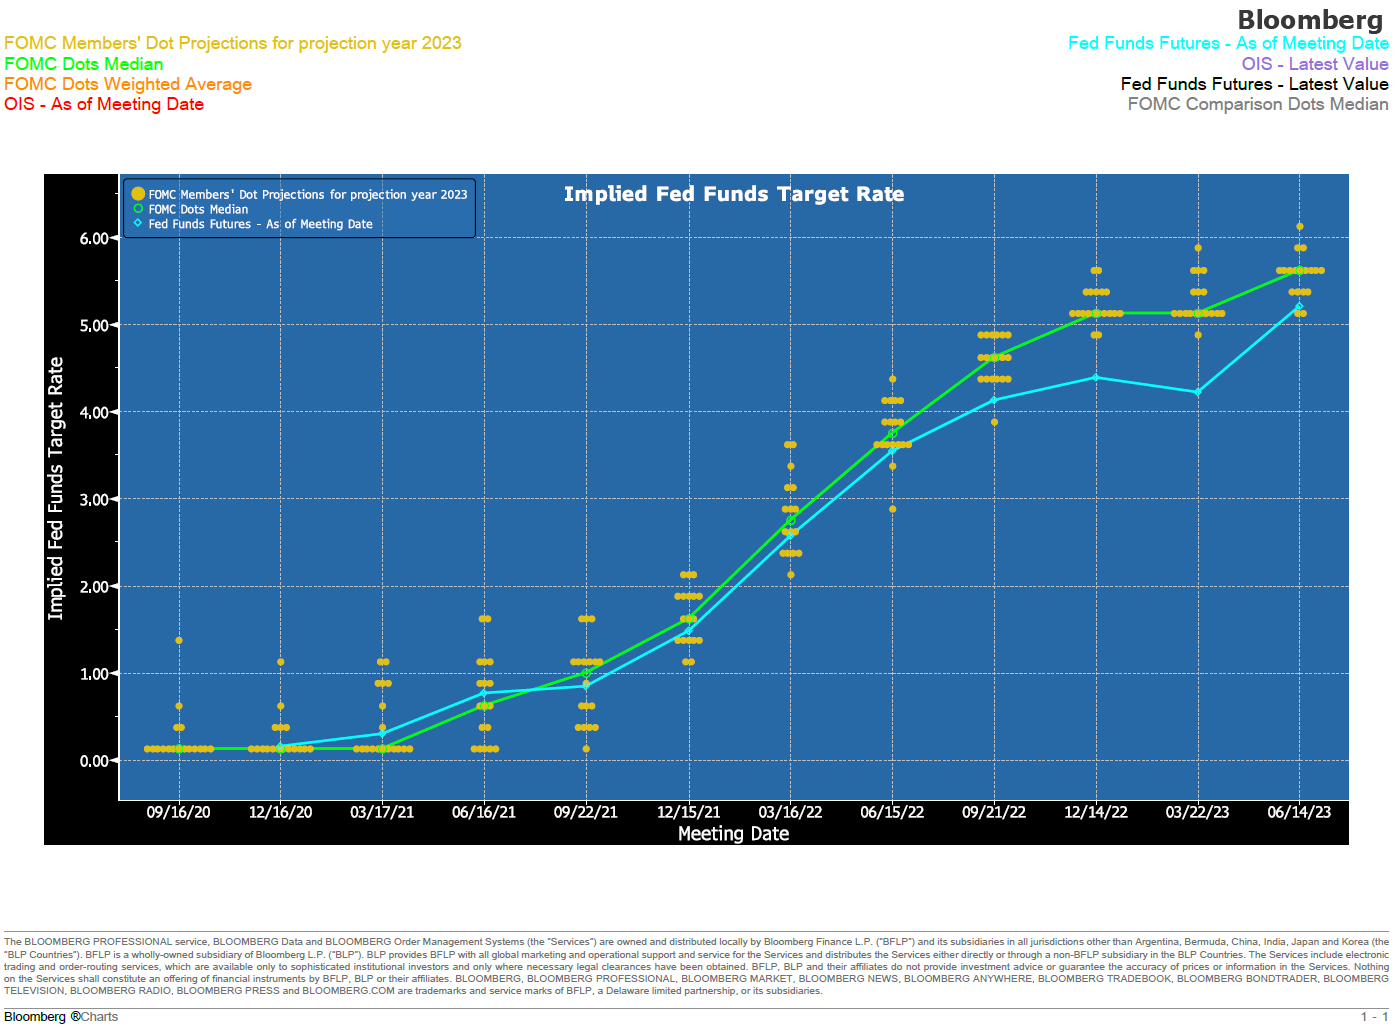
Economists at the Federal Reserve have consistently underestimated the amount of monetary tightening that the Fed would have to do to bring inflation under control. For the past two years, the FOMC has raised its terminal Fed funds estimates from less than 1% to now 5 ½%. The market, as seen in the implied Fed funds rate (the blue line), has been even further behind in its forecast for the terminal level of Fed funds (Chart 10).- Chart 10
-
Implied Fed Funds Target Rate, 2020-2023
-
-
Source: Bloomberg
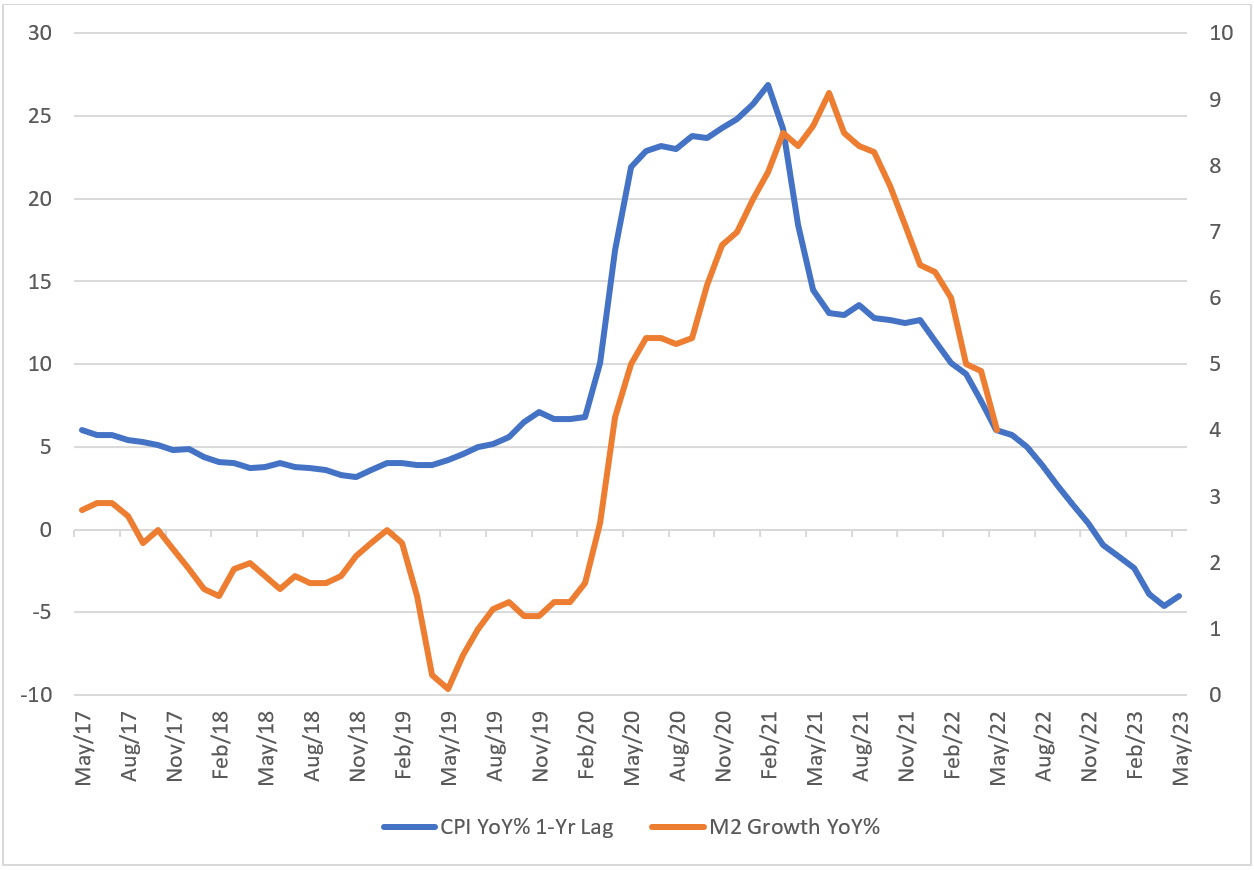
For all the brainpower expended on forecasting markets and economic data, investors would be better served by focusing on the fundamentals. Inflation is a monetary phenomenon, as Milton Friedman wrote and we have quoted ad nauseum. It is the result of an imbalance between the supply of and the demand for money. At the onset of the pandemic, the demand to hold money increased, and the Fed responded by supplying more money, thus keeping supply and demand in balance. Had the Fed not acted, the result would have been deflation. But as the economy reopened, the demand to hold cash subsided and the Fed should have withdrawn liquidity to maintain a balance of supply and demand. Instead, it allowed the money supply to surge, and this is why we have inflation. Rather than building complex mathematical models to forecast inflation, simply tracking the supply and demand dynamics of money would have been more effective. Chart 11 shows the growth of money (M2), lagged a year, versus inflation.
- Chart 11
-
CPI (Lagged 1-year) and M2 Growth, 2017-2023
-
-
Source: Bureau of Labor Statistics, Federal Reserve
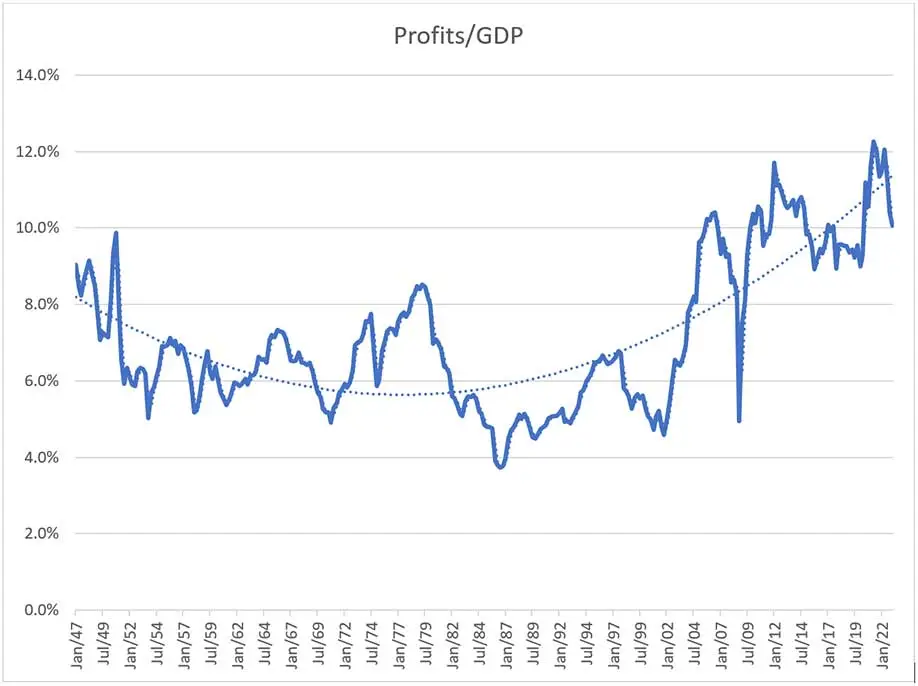
Likewise, stock market prognosticators should simply follow the earnings of companies. Equity owners have a claim on profits, and it is these profits that drive equity markets (Chart 12).
- Chart 12
-
Corporate Profits as Percentage of GDP, 1947-2023
-
-
Source: Bureau of Labor Statistics
Isabel Schnabel, a German economist and member of the Executive Board of the European Central Bank (ECB), recently acknowledged how very wrong policymakers have been about the path of inflation. "A narrow reliance on projections can lead to large policy mistakes," she said, as the ECB, along with other central banks, struggle to fit the actual data into their models. One might suggest they take the opposite approach, and fit their models to the data. She did seem to acknowledge that "giving more weight to observable data…can improve the quality of policy decisions." Well, yes.
Isaiah Berlin was born in Riga to a family of timber merchants, one of the wealthiest in the world, with vast land holdings throughout the Baltics and Russia. He moved to St. Petersburg as a young boy in time to witness the opening salvos of the Bolshevik Revolution from his apartment balcony. The family wisely decided to relocate to London, where Isaiah attended Oxford University and spent the rest of his life there, becoming one of the 20th century's most famous philosophers.
He is best known for his 1958 lecture, "The Two Concepts of Liberty," where he defined and distinguished "negative liberty" from "positive liberty." Negative liberty was derived from Thomas Hobbes' work, and was defined as the absence of interference in personal actions by public officials. Positive liberty was defined as the reverse of negative liberty, that is, not what we are free from, but what we are free to do. He saw that these two liberties could be in opposition, when one person's freedom of action impinges on another person's freedom from that action.
It follows that moral values may be equally valid, but mutually incompatible, and thus potentially come into conflict. Liberty, for example, may conflict with justice. For Berlin, this clashing of values that may be equally valid but mutually incompatible constitutes the tragedy of human life.
As a Russian, Berlin revered Leo Tolstoy. War and Peace, in particular, was a brilliant exposition of the realities of Russian society during the Napoleonic War and in its aftermath. Tolstoy perfectly captures in poetic detail the pain and suffering and loss that touched every family, but also the hope and glory and joy that accompanied both the war and the peace.
Berlin admired Tolstoy for his incomparable descriptions of these complex realities and relationships, yet was struck by how Tolstoy, in his personal life, so completely eschewed war and violence of any kind. Tolstoy himself fought in the wars in Crimea and in the Caucasus, but became a pacifist thereafter.
In a 1904 essay, called "Bethink Yourselves!", written in response to the Russo-Japanese War, Tolstoy wrote, "Stupefied by prayers, sermons, exhortations, [thousands of soldiers] will commit the most dreadful act of killing men whom they do not know and who have done them no harm." Shortly after Putin's invasion of Ukraine a man posting those words was arrested for discrediting the Russian army. Another man was arrested in Red Square for simply holding aloft a copy of War and Peace. Tolstoy was never so relevant as he is today.
But this contradiction in Tolstoy's character, the difference between what he actually was and what he believed he was, drew him as a subject for Berlin's analysis. In 1953, he published an essay that was not meant as a serious work. "I meant it as a kind of enjoyable intellectual game," he wrote. It became Isaiah Berlin's most famous work.
For a title, and to frame his argument, Berlin reached back to Archilochus, to one of the fragments of his poetry we have. Archilochus wrote, "The fox knows many things, but the hedgehog knows one big thing." Berlin admits that this may be taken literally, that for all its cunning, the fox cannot defeat the hedgehog that has curled up into an impenetrable ball of quivers. But for Berlin, the fox and the hedgehog represent "the deepest differences which divide writers and thinkers, and, it may be, human beings in general."
Berlin saw "a great chasm between those, on one side, who relate everything to a single central vision, one system, less or more coherent or articulate, in terms of which they understand, think and feel – a single, universal, organising principle in terms of which alone all that they are and say has significance – and, on the other side, those who pursue many ends, often unrelated and even contradictory, connected, if at all, only in some de facto way, for some psychological or physiological cause, related to no moral or aesthetic principle."
Berlin then classified Dante, Plato, Hegel and Nietzsche as hedgehogs, and Shakespeare, Aristotle, Erasmus and Goethe as foxes. For Tolstoy, however, there was no clear answer. Berlin believed that "Tolstoy was by nature a fox, but believed in being a hedgehog. That his gifts and achievement are one thing, and his beliefs, and consequently his interpretation of his own achievement, another." Berlin went on, "The conflict between what he was and what he believed emerges nowhere so clearly as in his view of history, to which some of his most brilliant and most paradoxical pages are devoted."
The classification of people as either hedgehogs, who know one thing to be true and pursue it devotedly, and foxes, who examine many things, often contradictory, before forming an opinion, has been picked up in other fields beyond literature. Jim Collins, in his 2001 bestseller, Good to Great, extoled the virtues of the hedgehogs, the fanatically devoted titans of business who pursued a singular vision and built world-class companies.
There is certainly merit to those who are focused and driven to achieve a goal, but theirs is a vision that is very limiting in accomplishing most endeavors because collaboration with differing perspectives cannot be tolerated and therefore important truths will be missed.
This is especially relevant for investors. Philip Tetlock, now at the University of Pennsylvania, has conducted research into forecasting for the past three decades. His research has demonstrated clearly that the better forecasters are not those with the more impressive credentials or expertise, but those that were open to multiple perspectives, were curious and self-critical and unafraid to change their minds.
These are the traits of successful investors. Economic models are doomed to fail because, by definition, they see (analyze) the world through a single perspective. The world does not have a single perspective.
The great sculptor Richard Serra created his monumental work, The Hedgehog and the Fox, in 1999. Installed on the campus of Princeton University, it is 94 feet long and 15 feet high*, comprised of two identical conical/elliptical sheets of steel. Their fluidity and rust color denote the likeness of the fox, while the tops imply the sharp points of the hedgehog's back. For Serra, the Hedgehog and the Fox represents the choice each of us has, to "become free thinkers and invent, or become subjugated to the dictates of history. This is the classical problem posed to every[one]."
The last word goes to Archilochus: "We don't rise to the level of our expectations; we fall to the level of our training." We are inundated with data, with facts, with lies, with information and misinformation. It is only by being a fox, by having a broad curiosity, by embracing uncertainty and contradictions, by being self-critical and self-reflective, that we can hope to become successful investors.* Approximately 29 meters by 5 meters
-
![Michael Rosen]()
-
Michael A. Rosen
Principal & Chief Investment Officer
Michael Rosen, co-founder and Chief Investment Officer of Angeles Investments, has 37 years of experience as an institutional portfolio manager, investment strategist, and investment consultant.
Please see more insights from Michael Rosen and Angeles here:
www.angelesinvestments.com/insights/home -
July 2023
Connect with us
![Angeles on Linked In]()
Founded in 2001, Angeles is a multi-asset investment firm, building customized portfolios for institutional and private wealth investors.
This report is not an offer to sell or solicitation to buy any security. This is intended for the general information of the clients of Angeles Investment Advisors. It does not consider the investment objectives, financial situation or needs of individual investors. Before acting on any advice or recommendation in this material, a client must consider its suitability and seek professional advice, if necessary. The material contained herein is based on information we believe to be reliable, but we do not represent that it is accurate, and it should not be relied on as such. Opinions expressed are our current opinions as of the date written only, and may change without notification. We, along with any affiliates, officers, directors or employees, may, from time to time, have positions, long or short, in, and buy and sell, any securities or derivatives mentioned herein. No part of this material may be copied or duplicated in any form by any means and may not be redistributed without the consent of Angeles Investment Advisors, LLC.
If you would like, please click this link to receive a copy of our Form ADV Part 2A free of charge. -