-
![Michael Rosen]()
-
Investment Insights are written by Angeles' CIO Michael Rosen
Michael has more than 30 years experience as an institutional portfolio manager, investment strategist, trader and academic.

NEGATIVE NEGATIVE IS POSITIVE
Published: 08-22-2016
Housing is a small part of the larger economic picture, contributing only about 5% to GDP (although including all the ancillary and related services probably triples that number). Still, for most people, equity in their homes represents the single biggest investment they have, and for many, maybe the only investment they own.
Many statistics about this economic recovery are disappointing, especially the very sluggish growth rate, averaging just over 2% p.a. since 2010. Other data are more encouraging, such as the halving of the unemployment rate from 10% to under 5%. One of the more impressive markers of recovery is found in the housing data. Five years ago, nearly one-in-three homes were underwater, that is, their mortgages were greater than their house was worth. Today, that number is less than one-in-eight (see below).
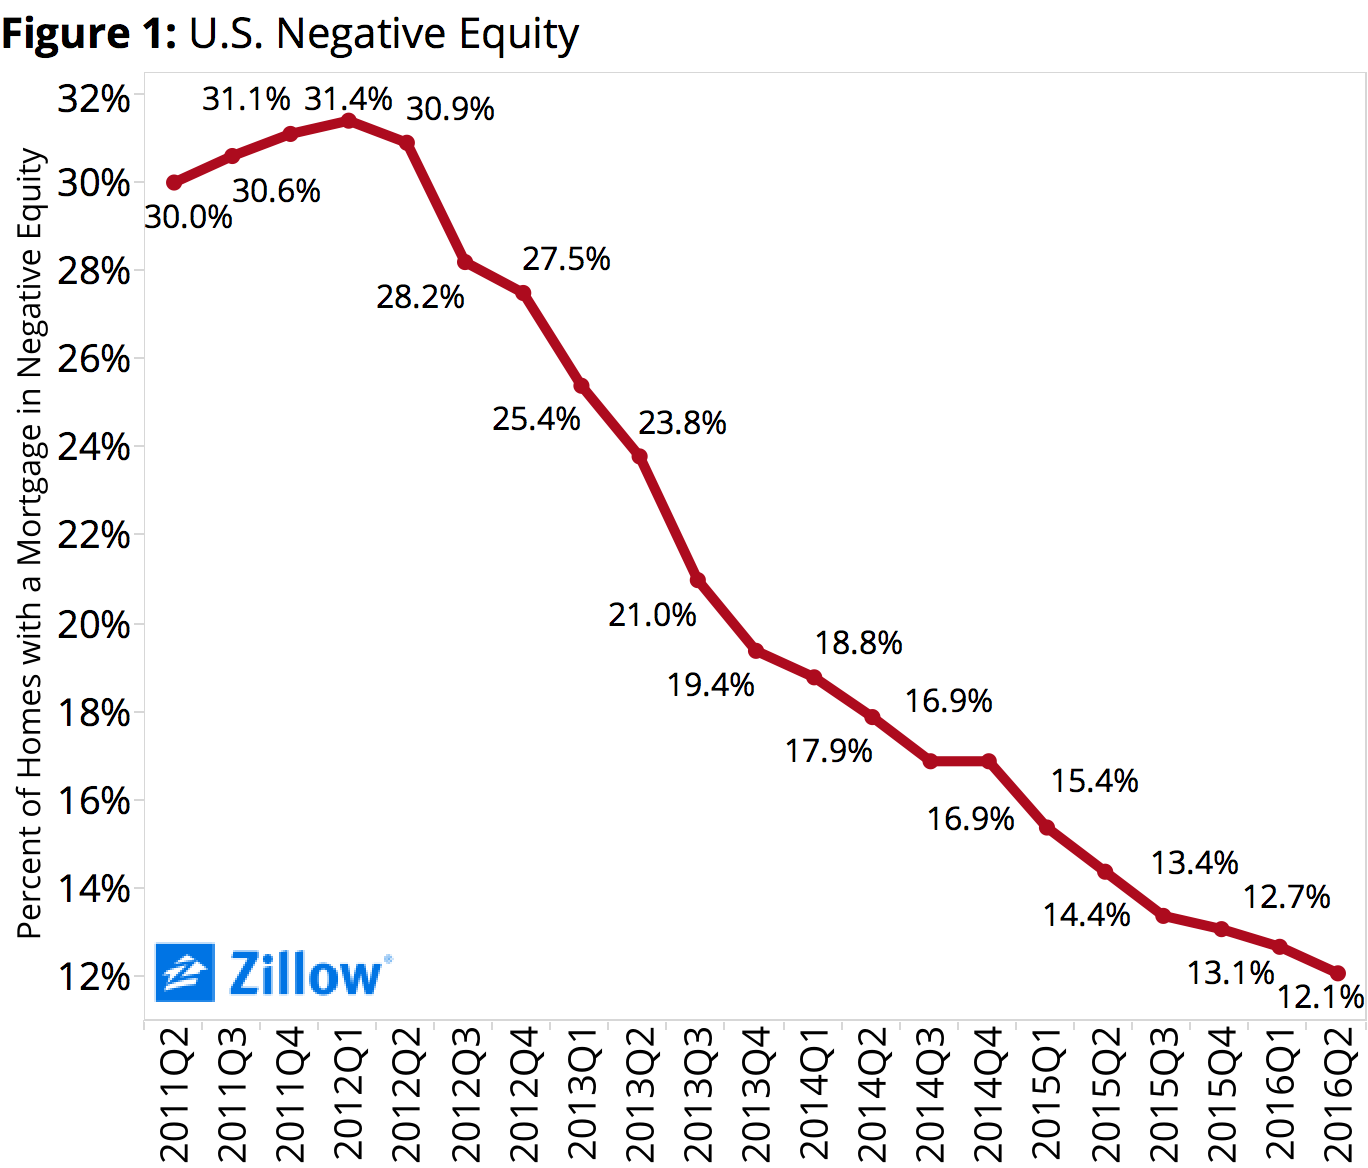
To be sure, this is a national average, and there are wide pockets of underwater homes throughout the country (see below), but overall, there’s been a lot of recovery in home values.

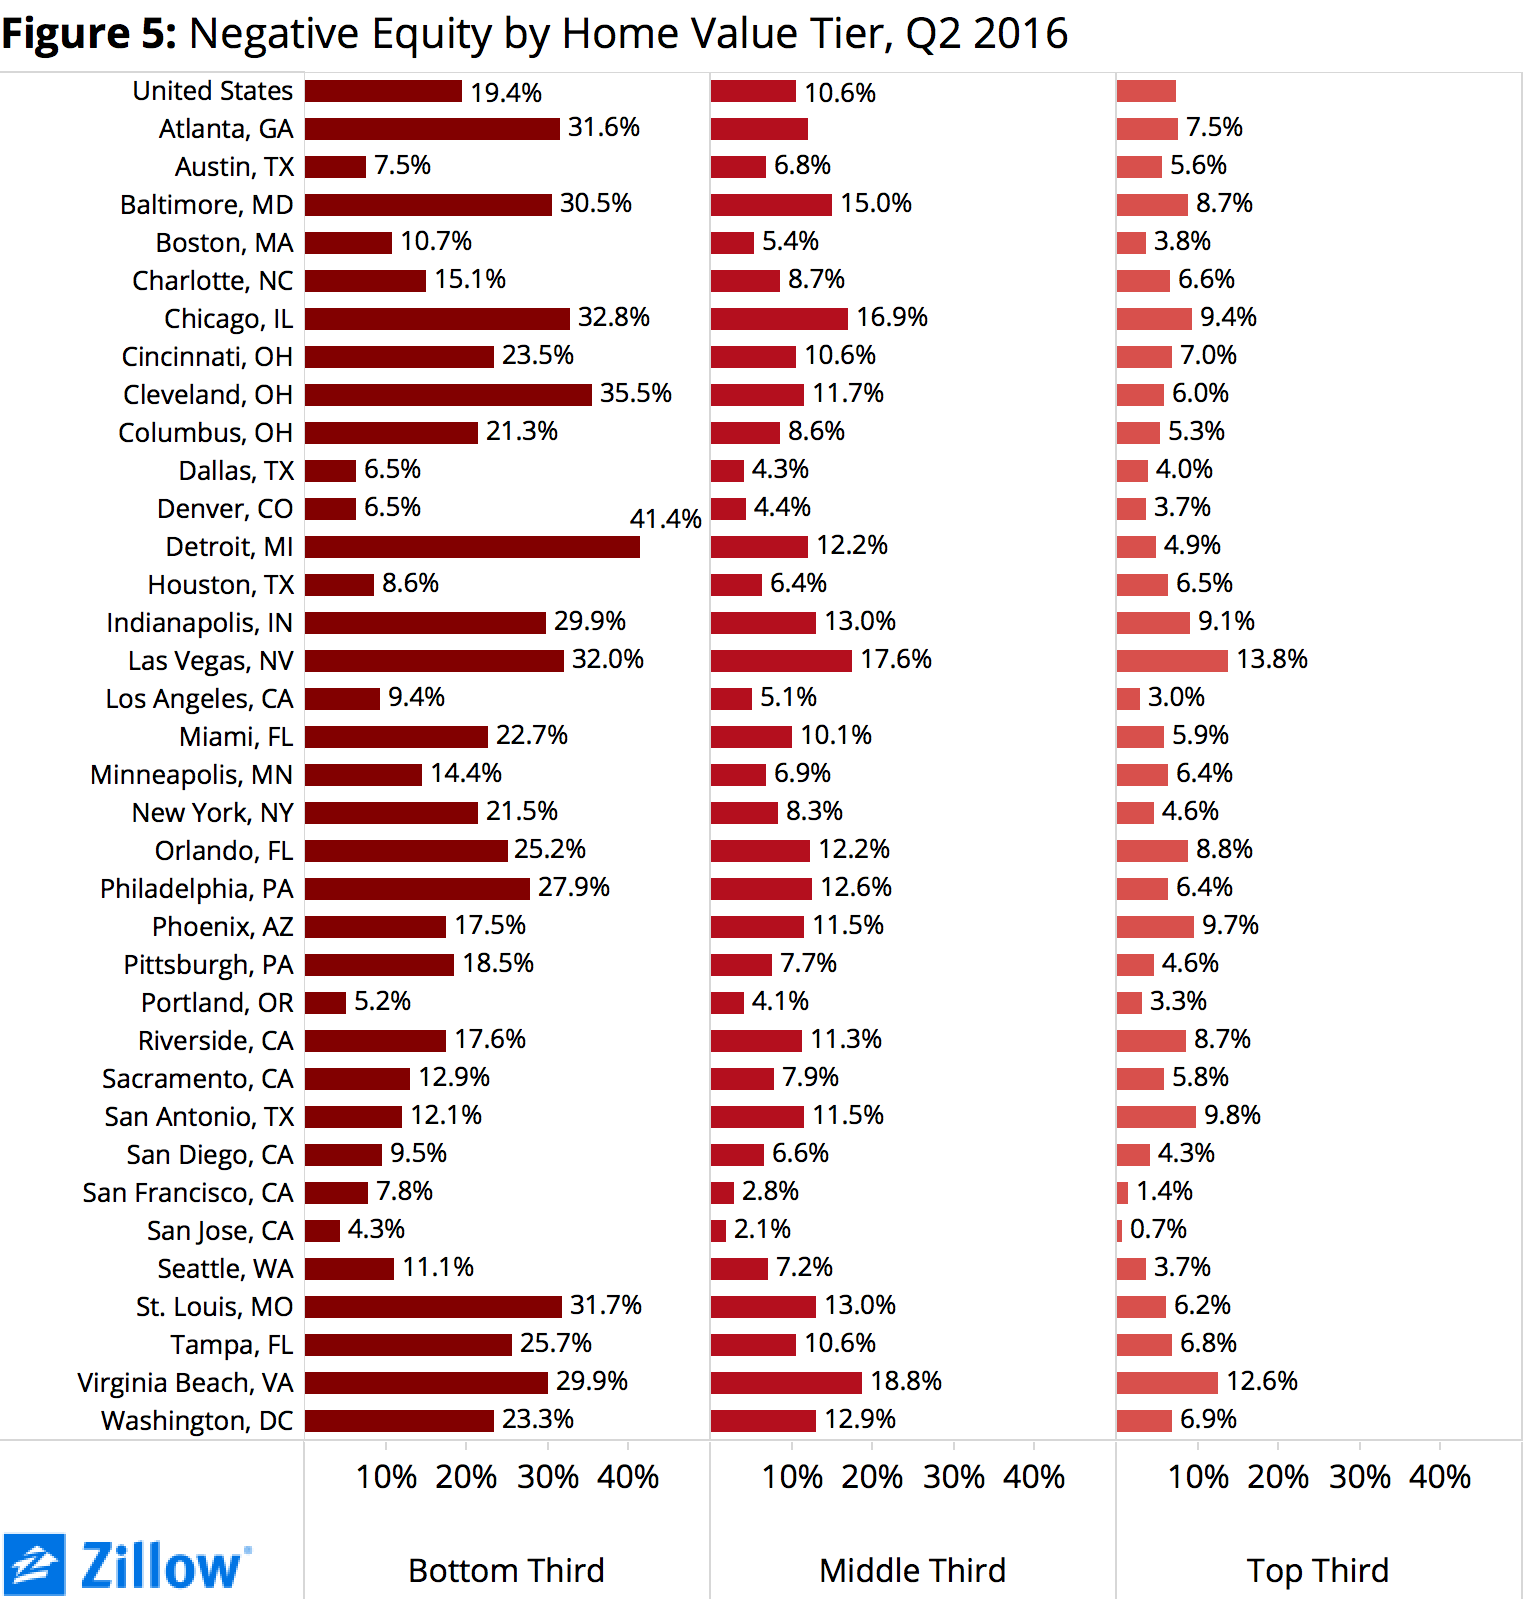
In the 35 largest MSAs (metropolitan statistical areas), Las Vegas has the highest percentage of homes with negative equity (19.5%), followed closely by Chicago (19%). California ranks pretty high, with the two lowest markets with homes underwater, San Francisco (4.0%) San Jose (2.4%).
In every metropolitan area, negative equity is more pervasive in the lower tier of homes than in the higher tier, on average, 19.4% versus 7.3%. Detroit has an especially wide gap: the highest percentage in the nation of homes underwater in the lower tier (41.4%), with an upper tier that is stronger than the national average at just 4.9%. The upper tier in Las Vegas still lags with 13.8% of homes with negative equity, a nationwide high. And again, San Jose stands out as the strongest market, with just 4.3% of lower tier homes underwater, and just 0.7% in the higher end (see table).
The improvement in the equity positions of homeowners has coincided with a declining rate of home ownership, peaking at 69.2% in 2004 and now at 50-year lows (62.9%—see graph below).
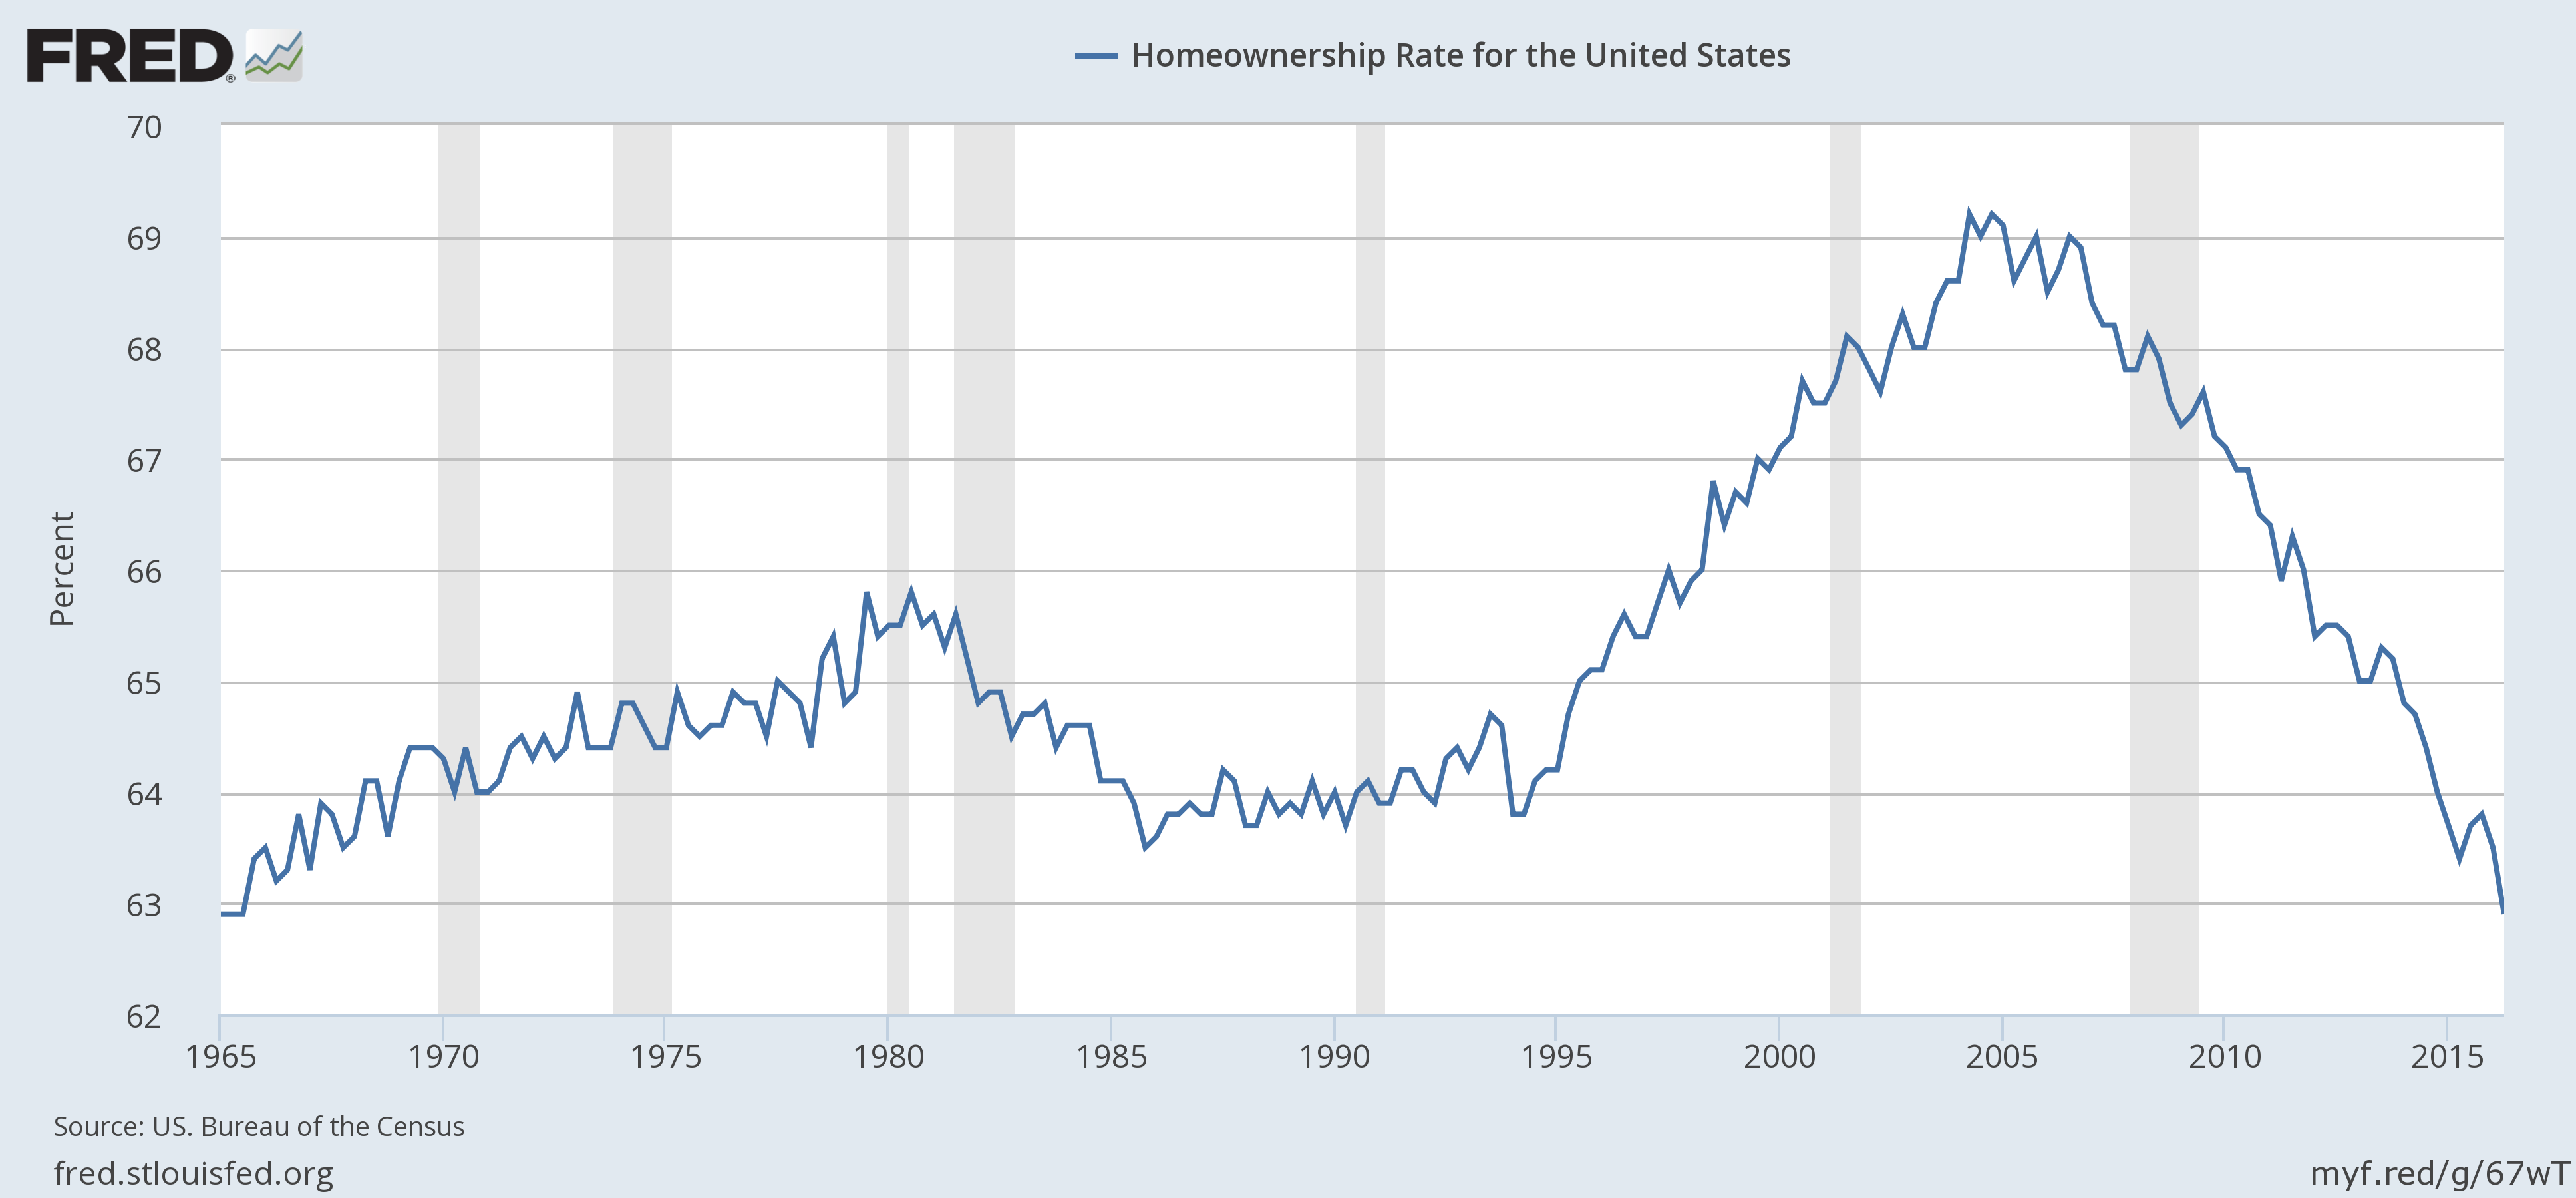
Declining home ownership is not necessarily a bad thing. In the 1990s, social engineers theorized that home ownership was a social good, to be promoted. Taxpayer subsidies of trillions of dollars supported the housing industry (still do), and it’s clear we incented many to buy homes who should not have done so. I see the lower home ownership rate as closer to restoring a sustainable equilibrium than a cause for concern.
Acknowledging the many areas of the country with a still-elevated number of homes with negative equity, especially in the poorer neighborhoods of most cities and regions, overall, there is less negative equity across the country, and (encouragingly for some of us) California is especially strong. As we learned in elementary school, multiplying two negatives results in a positive, which is the message we see in the housing data.