In A Hole
Two months ago, I offered some hope that drop we saw on the first day of 2016 was a good omen for the rest of the month and year (http://blog.angelesadvisors.com/2016/01/apres-moi-le-deluge/). I noted that, of the 14 opening day declines since 1928, only 3 (1957, 1978, 2008) portended weak first months. And while 1957 and 2008 were down years for US equities, 1978 was positive. So there was hope (statistically).
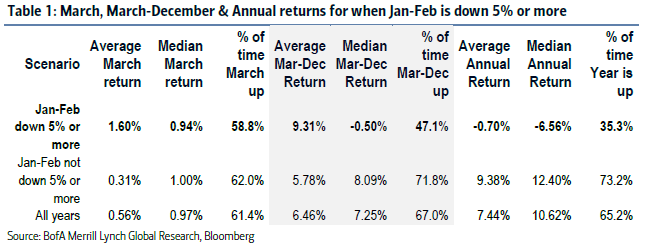
Forget it. There are lies, damn lies, and statistics (as Mark Twain wrote), and this statistic certainly lied. US stocks lost 5% in January, with another fractional loss in February, making this the 17th worst start to a year since 1928. So what now? The table below provides the history.
The data say that when the first two months are down more than 5%, the next month is likely (58.8% of the time) to be up about 1% (median). That’s the good news. The rest of the year will likely be down, with a median return of -0.50% the rest of the year. There is only a 35% likelihood that 2016 can redeem itself with a positive return for the full year.
So the data suggest we crawl along for the rest of the year. Of course, the same data also said the opening day drop was likely a positive signal. But statistics is a funny thing: the fact that reality did not comply with its probability does not mean that the next observation will also fall outside expectations. At least, not necessarily, which is probably why Mark Twain had little time for them.