How The Mighty Fall
Published: 11-11-2014
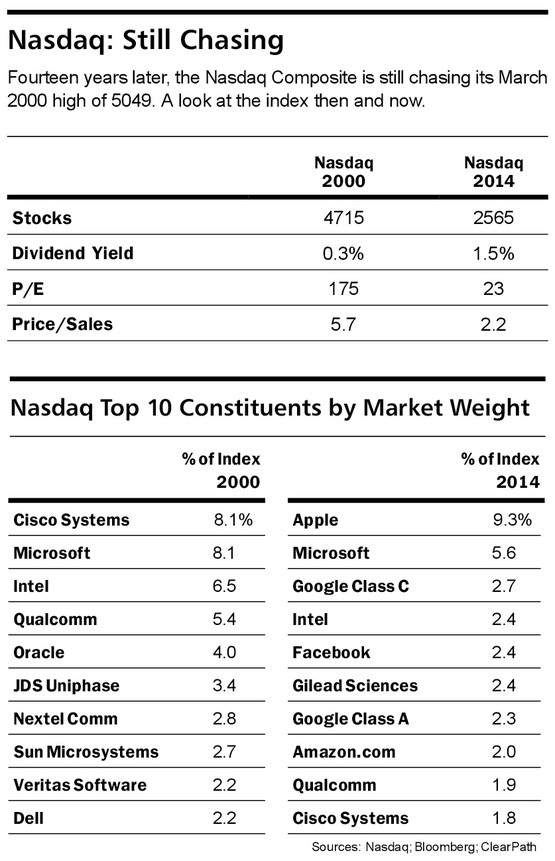
Between March 2000 and October 2002, the NASDAQ Index fell 75%, from over 5,000 to under 1,300. Of course, valuations were beyond silly at the peak, and I confess, following the collapse, I thought my children might one day see the index surpass its previous high.
Well, 12 years later, the NASDAQ is within 10% of its 2000 high. It’s not there yet, and it’s been a long slog to recovery, but it’s getting there.
The chart below, from Barron’s, shows the largest constituents then and now. The top 5 in 2000 still around, but 6-10 have all disappeared, either acquired or taken private. A good reminder how hard it is to stay on top.