Breathe

Twenty-five hundred years, Siddhartha Gautama practiced a form of meditation that involved controlled breathing. Much later, about 700 years ago, this practice, called pranayama, was codified in the most famous of Hindu texts, the Bhagavad Gita. More recently, Western science has validated the physiological benefits of pranayama. Respiratory functions are improved (increased tidal volume, ventilation efficiency, arterial oxygenation, etc.), cardiovascular system is enhanced (greater cardiac output, synchronization of vasomotion, increases heart rate variability, decreases blood pressure, etc.), and the autonomic nervous system benefits (increases vagal activity, improves phasic modulation of sympathetic activity, etc.). Here’s a simple diagram:
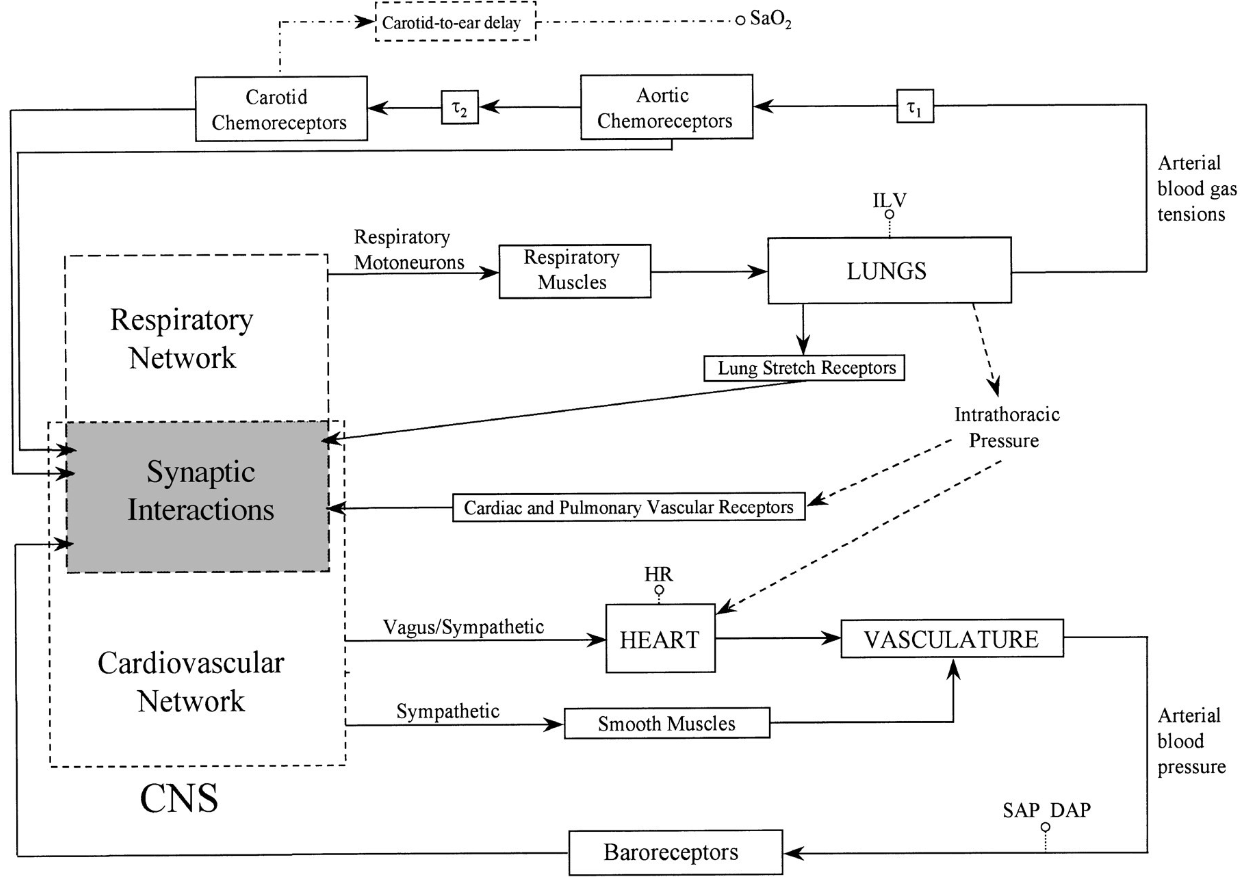
Source: G. D. Pinna, R. Maestri, A. Mortara, and M. T. La Rovere, Cardiorespiratory interactions during periodic breathing in awake chronic heart failure patients, March 2000.
The survival instinct is genetically encoded in humans: when we see sudden movement in front of us, we react with common physiological features: rapid heartbeat, surge of adrenaline, and increased neurological activity to assess the danger and determine whether to flee or fight. It could just be a bird in the thrush, but it might be a hungry bear.
This year-to-date chart of the S&P 500 Index demonstrates that investors see a bear in the bush, and not a bird, and are fleeing from this potential danger.
S&P 500 Index 2018 Year-to-Date
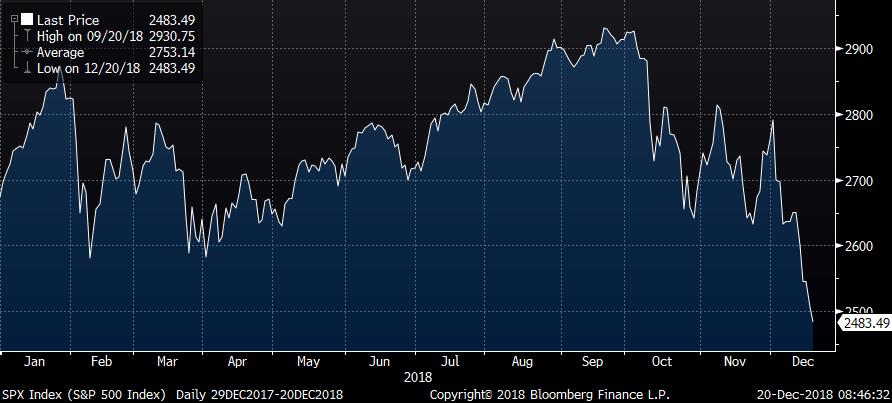
The S&P 500 Index is down a little more than 5% this year (including dividends), but it is off more than 15% from its all-time high in September. We know that equities fluctuate considerably, but how do we know if or when a bull market turns into a bear, or vice versa? The answer may be found in two areas, fundamentals and perspective.
Earlier this year, I argued that bear markets come in different flavors (https://blog.angelesadvisors.com/2018-angeles-foundation-symposium/). There are the frequently-occurring, usually swift, and generally benign bear markets of 15-20% declines. These are usually triggered by one-off events, and we recover in short order. There are the larger bear markets, with declines of 20-30%, associated with a turn in the economic cycle (recession), and can take longer to rebound to new highs. Then there are really bad bear markets, 40-50% declines, associated with some major structural imbalance (leverage, valuations, e.g.). I advised ignoring the first kind of bear market, because it would likely be over before we could respond. But what about the other two, is the economy about to contract or, even worse, are valuations or leverage so excessive we should expect a major correction?
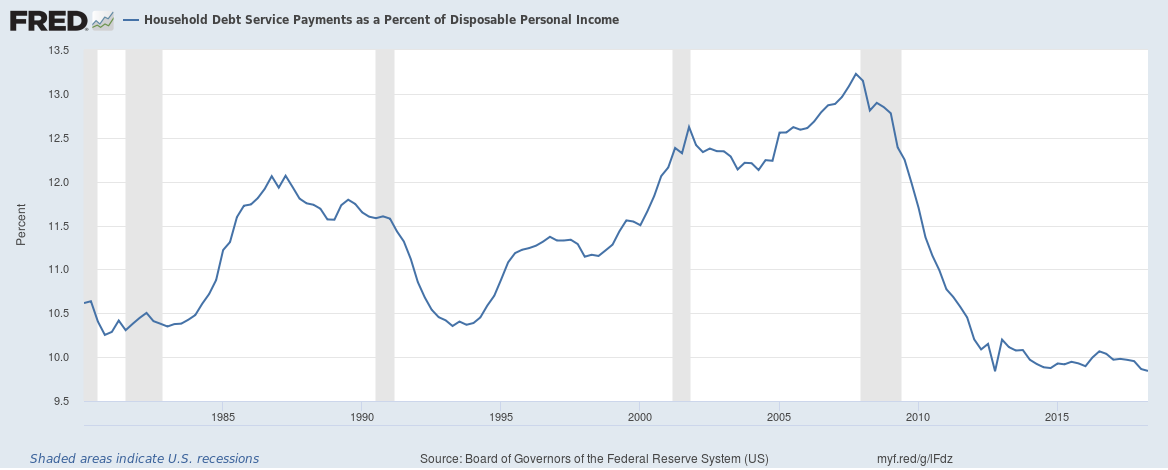
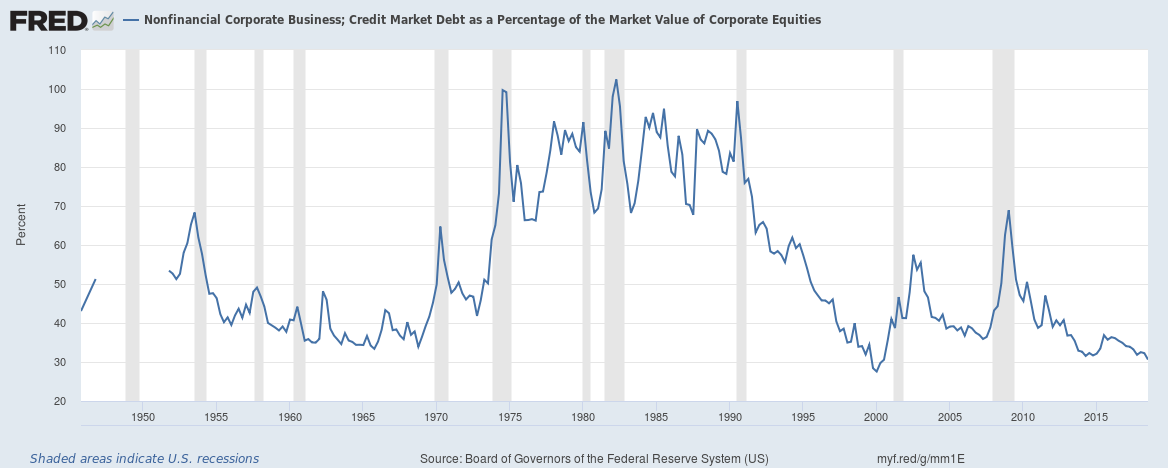
Let’s throw out the latter scenario. Leverage is actually below historical levels. Household debt service ratio is the lowest on record (since 1980—see graph below). Yes, corporate debt is at a record high, but so are profits, and relative to equity, near an all-time low (since 1945—see second graph below).
Household Debt as Percentage of Income, 1980-2018
Nonfinancial Corporate Debt as Percentage of Equity, 1945-2018
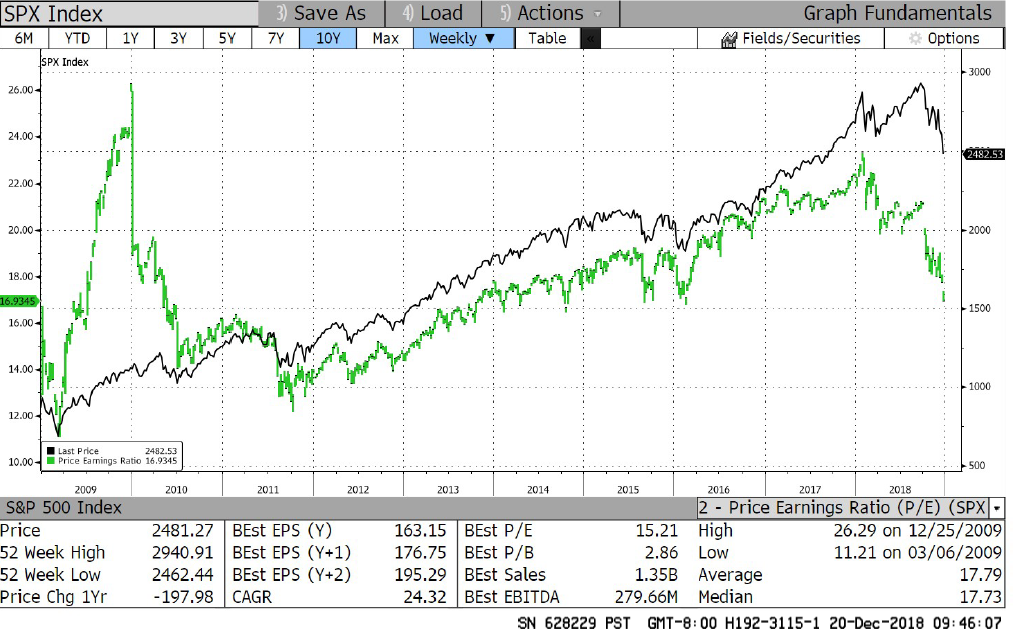
Neither are equity valuations excessive. If anything, valuations have diverged significantly lower (see graph below showing the S&P 500 Index price (black line) over the past 10 years and its P/E ratio in green). At 17x, US stocks are not cheap, but they are just below this past decade’s average.
S&P 500 Index and P/E Ratio, 2009-2018
The conditions for a brutal bear market, excessive leverage or valuations, are not present, and a major crash is very unlikely. That leaves the economic-cycle recession, that since 1945, has occurred every five years or so and sees an average decline of 25-30%. Could that be in the cards?
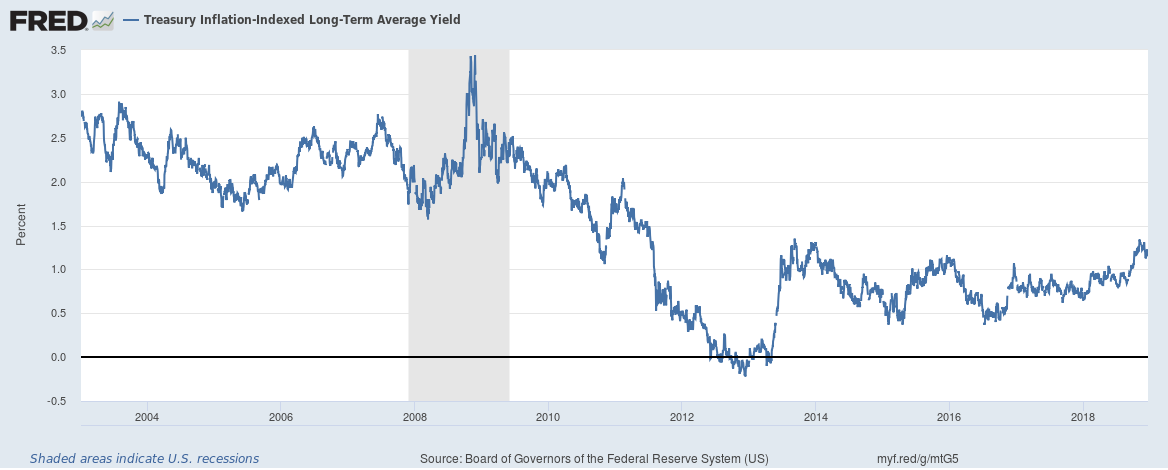
Sure, but the evidence isn’t there yet for an economic contraction. Leading indicators remain strong, manufacturing output is expanding, the consumer is healthy, the labor market is tight, and monetary policy is still accommodative. I know you’re thinking, “hold on,” monetary policy is accommodative? Isn’t the Fed tightening the screws? Yes, the Fed is tightening, but real yields of just over 1% are still well below long-term averages of around 2.5% (see graph below for the real yield of long-term TIPS).
Long-Term TIPS Yield, 2003-2018
The list of worries is long. Economic growth is slowing, especially overseas. China, which has been responsible for more than half of the world’s growth over the past decade, faces acute economic issues, from falling exports to rising debt levels. Europe is negotiating the impending train wreck of Brexit while France is racked with violent protests and Italy brazenly violates fiscal rules. Germany, Europe’s prime economic engine and political power, faces a change in government that is more likely to exacerbate than to heal rising political tensions. And finally, there is not enough space or enough words to describe the lamentable state of American politics, which is widening our wounds and weakening our global position.
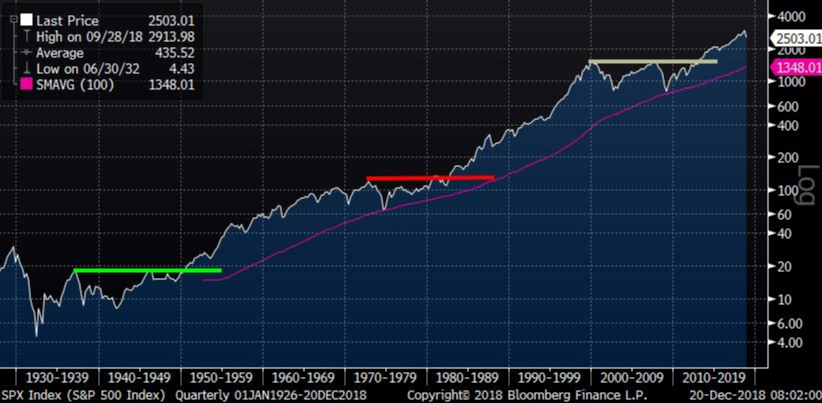
I said earlier that there are two areas of study to help us analyze conditions: fundamentals and perspective. I’ve laid out the fundamental picture, now let me say something brief about perspective. The first chart above of the S&P 500 Index this year, shows a plunging price to new lows. Given our natural instinct to extrapolate, this is a scary chart, because we can’t see a natural bottom. But stepping back, over the past 90 years, we see a different pattern (graph below, in semi-log scale). Markets move through cycles, and there are long periods (decades) of consolidation (no firm direction) and periods of advance. It’s important to note, although harder to appreciate with this semi-log scale, that many of the wiggles, during both periods of consolidation and advancement, represent large percentage swings. I’ve only lived through (consciously) about half the period below, but I know first-hand that each of these declines feels terrible. The loss on paper is bad, but the uncertainty of where the bottom is (if there is one) and when we will get there, is worse.
S&P 500 Index, 1928-2018
But with the right perspective, we can begin to see market declines as opportunities rather than as cause for panic. The rattling in the bush may be a bear, or just a bird, or just the wind. Let’s address that with a clear head and a calm heart. Breathe.